Salesforce Reports: Play Outcome Reports
How Effective are your Plays
Once a Play has been implemented, it’s sometimes hard to tell if it’s working. These reports help you track what is working in your Plays and locate weak spots. When a Playbooks user achieves the goal of a Play, they need to mark the Play as successful (easy two-click process). Otherwise future tasks for that record will continue to be prescribed in the rep’s daily task list. That is often enough incentive for reps but reporting around Play success helps reps stay accountable to the strategy and helps managers and ops teams know which Plays are effective, on which step they achieved success, and which Plays need revisions.
Play Success by User
“Which users are marking Plays as Successful?”
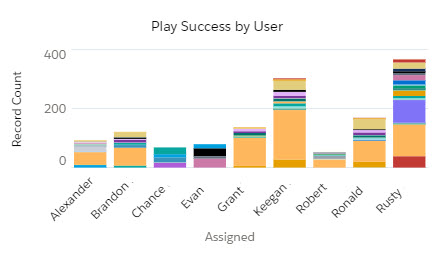
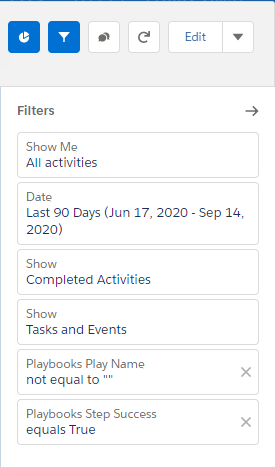
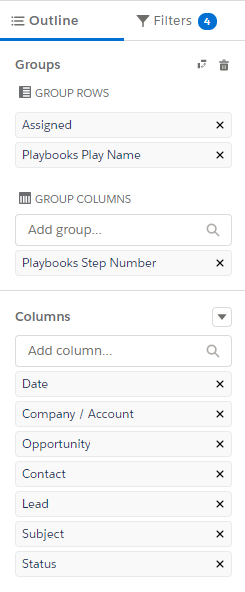
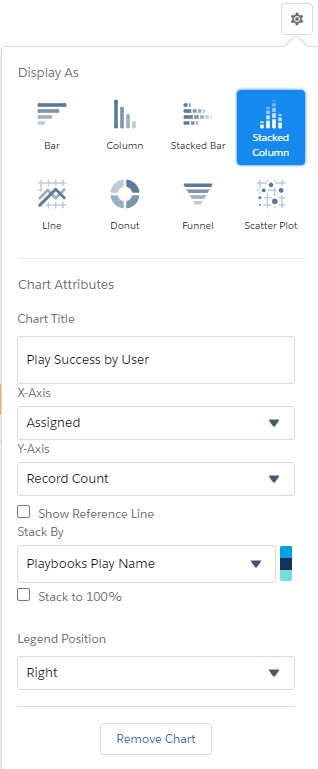
This activity report shows how many times users marked Plays successful in the last 90 days. When a rep marks a Play as successful, the last task completed gets updated with a check mark on the Playbooks Step Success field.
Each colored stack represents a different Play. All things being equal (record distribution, available time to complete tasks, etc.) this report can help to indicate which reps are having the most success and which reps need additional coaching.
Most Successful Play
“Which Plays are Successful at the highest rate?”
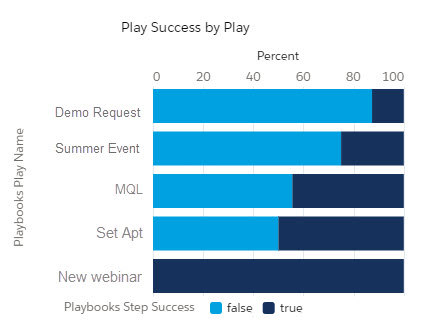
With this activity report, managers and ops teams can quickly identify which Plays are performing as expected and which are underperforming. Focus time and energy on updating Plays that are not reaching expected success rates.
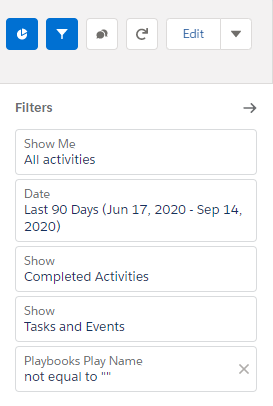
For this report to work correctly, you need to add this formula to the Percent column. Review the code below and click the button to copy the code.
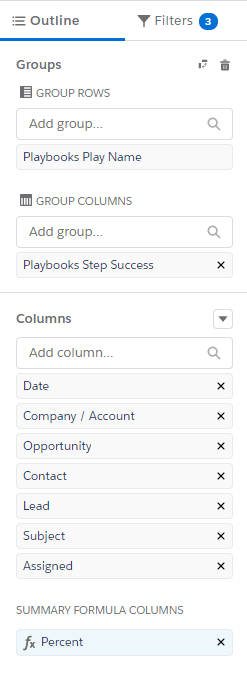
Click on Display and change the following settings as shown
- Where should this formula be applied? to Specific Groups
- Row Group to Playbooks Play Name
- Column Group to Playbooks Step Success
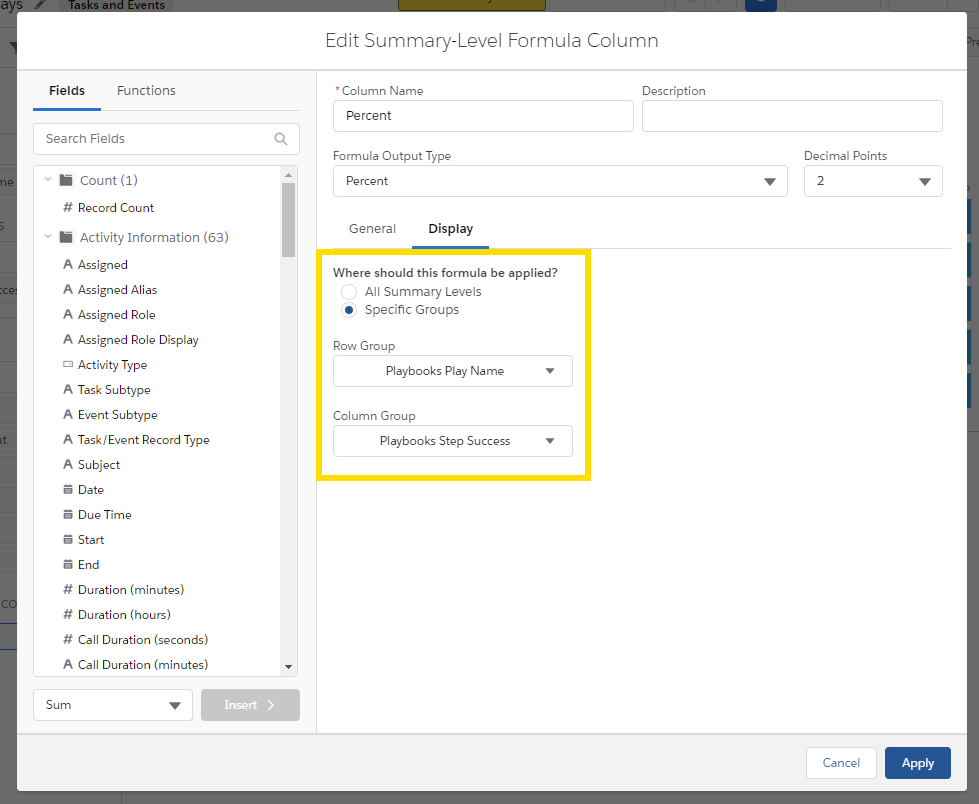
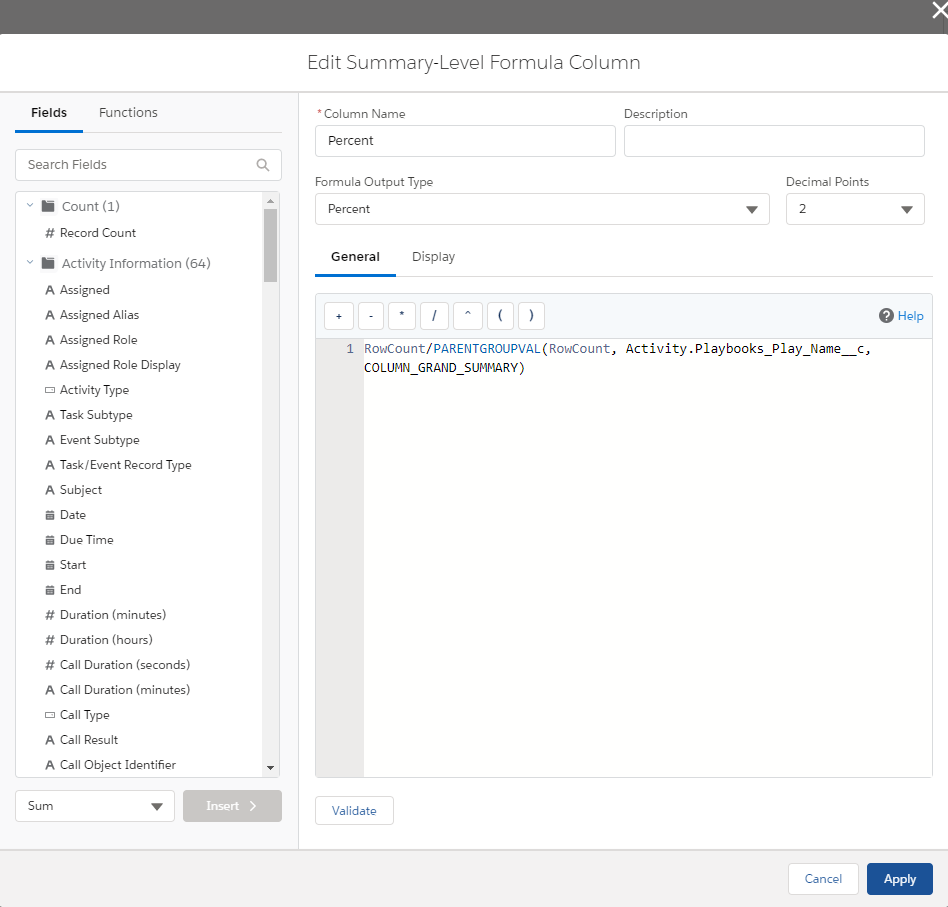
Column Name: Percent
Formula Output Type: Percent
Decimal Points: 2
Formula:
RowCount/PARENTGROUPVAL(RowCount, Activity.Playbooks_Play_Name__c, COLUMN_GRAND_SUMMARY)
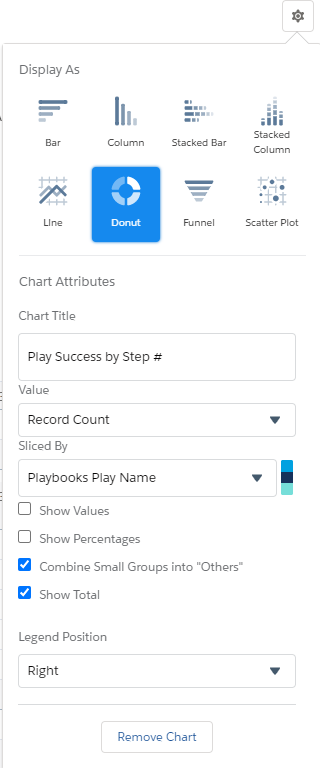
Play Adoption Assessment
“How many tasks have been completed in each Play (broken down by user)?”
This report will provide a view of the number of tasks completed by Play and Play Step. Which play has the most activities? Another way to view this information is in a donut chart giving a view of the distribution of effort (see advanced reporting tab for details).
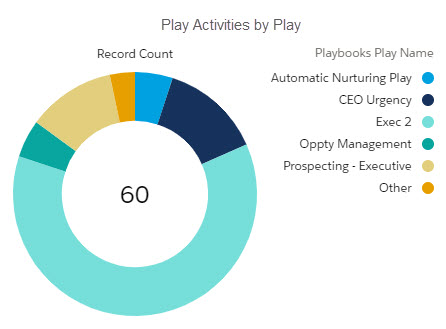
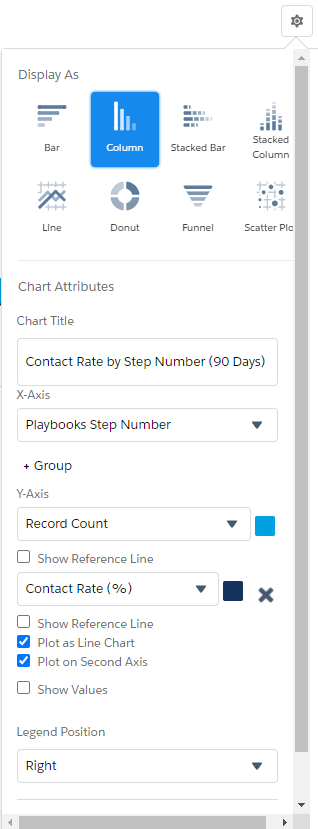
To create this report view, change the Chart Properties to Donut.
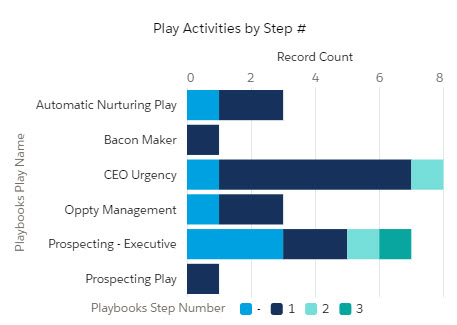
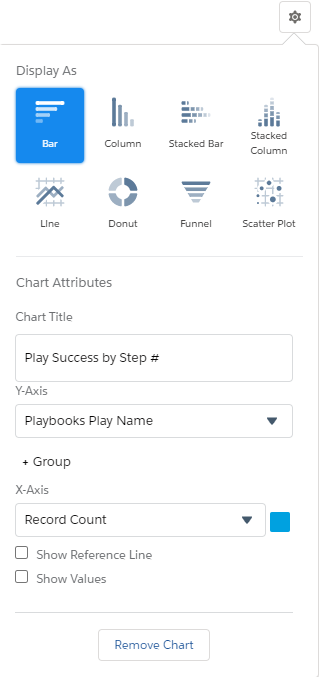
Play Success by Step Number
“Which Step is Success most common?”
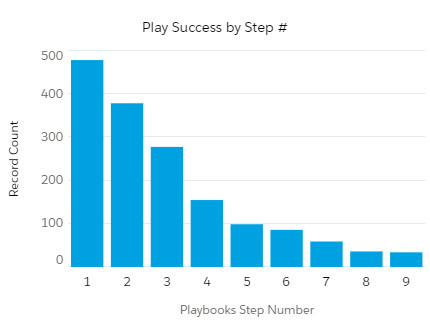
This report answers two important questions, what step has the highest success rate and at what point is there no more success? Depending on Play complexity, the average deal cycle, or even Lead Source, managers may find higher success several steps into a Play. This data should be shared with the team so they understand why they should stick with a certain Play cadence. Managers and Ops teams will also want to pay close attention to declining rates of success. Recognize the marginal utility of doing “one more step” is not always a good return for the time and energy of the team. Knowing when to call it quits or change to a different strategy/Play is a fine art.
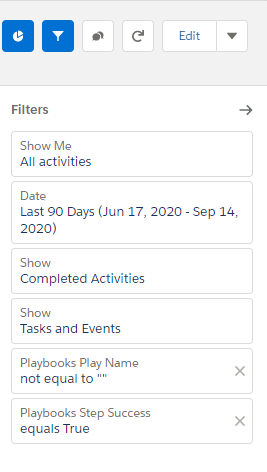

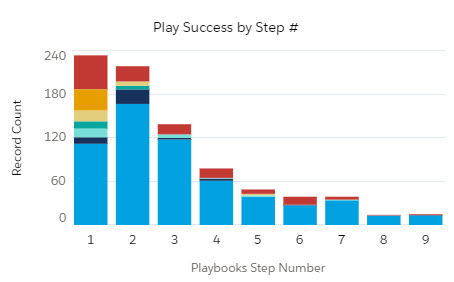
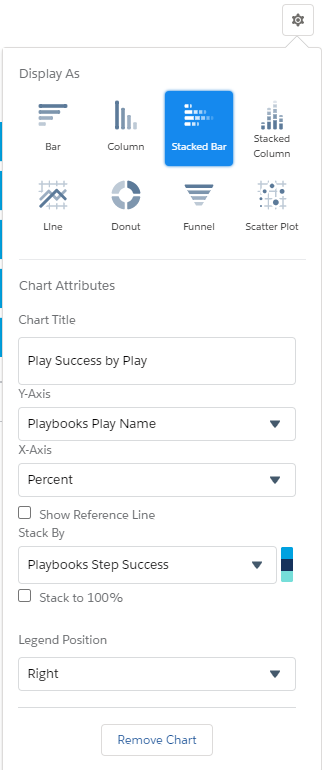
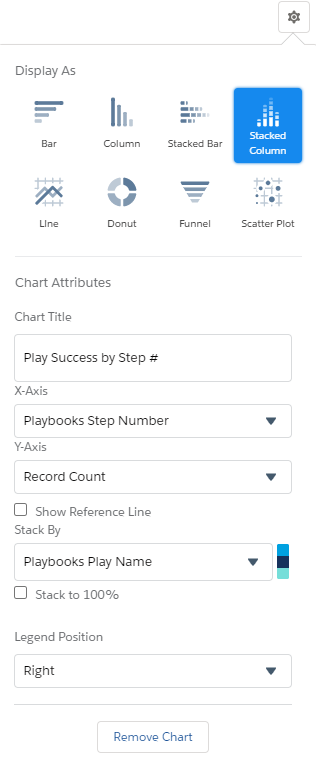
View success by step number of all Plays in a stacked column chart.
Contact Rate by Step Number
“For each Play Step, what is the Contact Rate?”
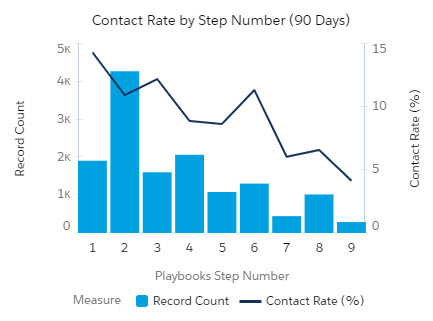
This report shows the contact rate for call steps by step number. Managers and ops teams can use this report to analyze the right amount of call steps that should be included in a Play, then augment the Play with additional steps through other channels.
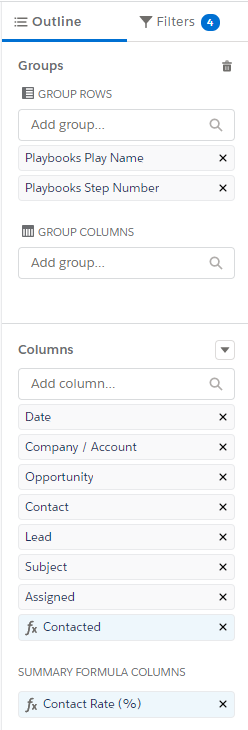
For this report to work correctly, you need to add this formula to the Contacted column. Review the code below and click the button to copy the code.
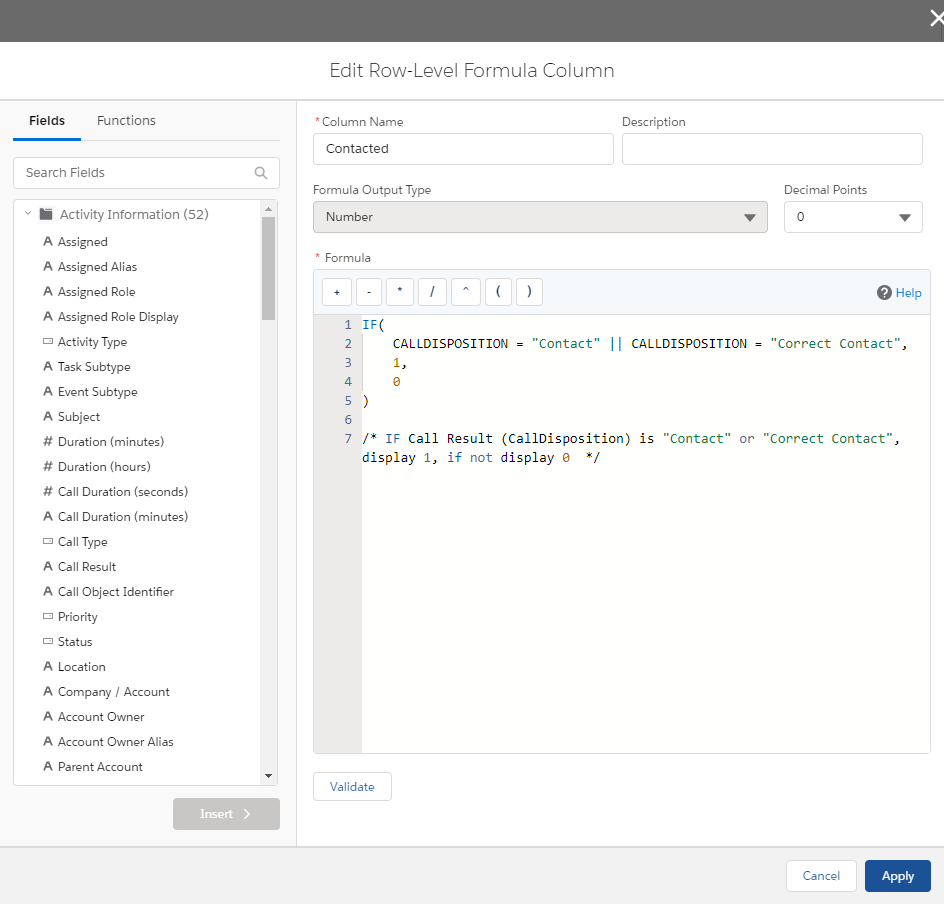
Column Name: Contacted
Formula Output Type: Number
Formula:
IF(

CALLDISPOSITION = "Contact" || CALLDISPOSITION = "Correct Contact",

1,

0

)


/* IF Call Result (CallDisposition) is "Contact" or "Correct Contact", display 1, if not display 0  */
This report requires a second formula in the Contact Rate (%) column. Review the code below and click the button to copy the code.
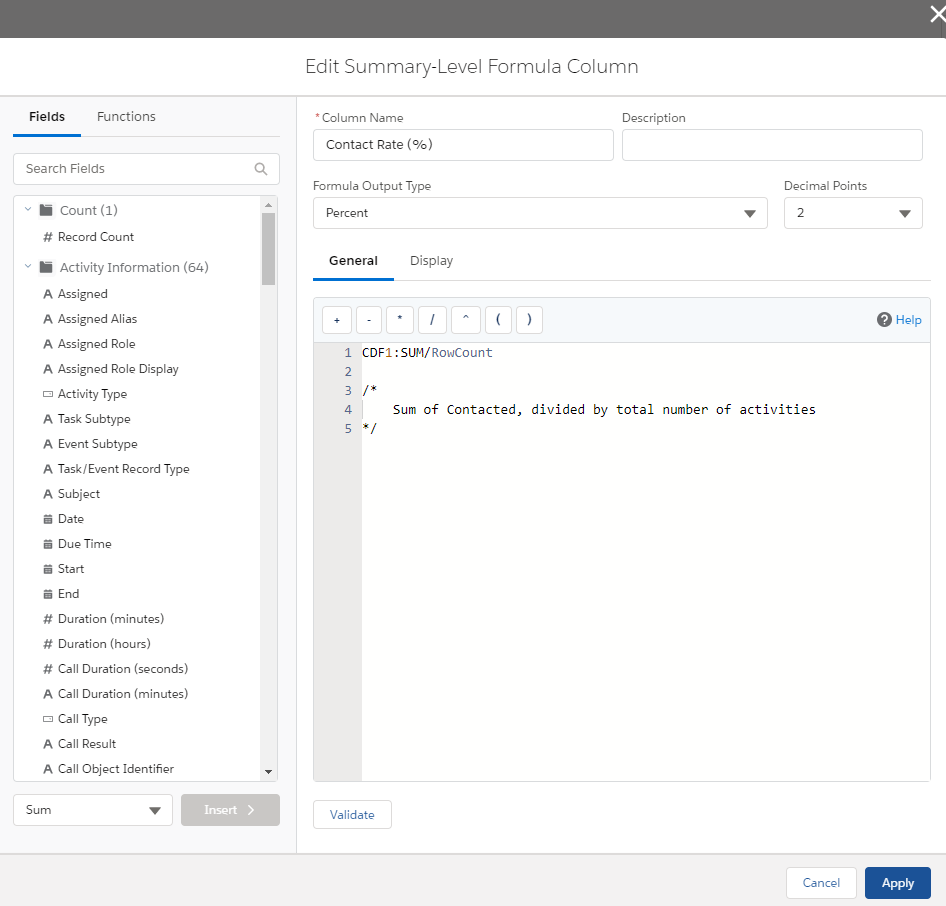
Column Name: Contact Rate (%)
Formula Output Type: Percent
Decimal Points: 2
Formula:
CDF1:SUM/RowCount
/*
    Sum of Contacted, divided by total number of activities
*/
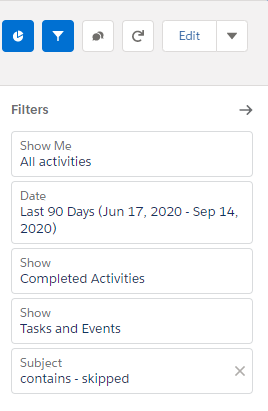
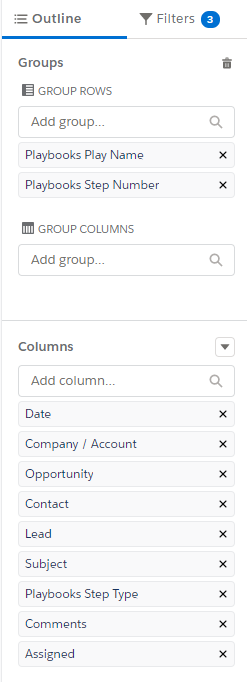
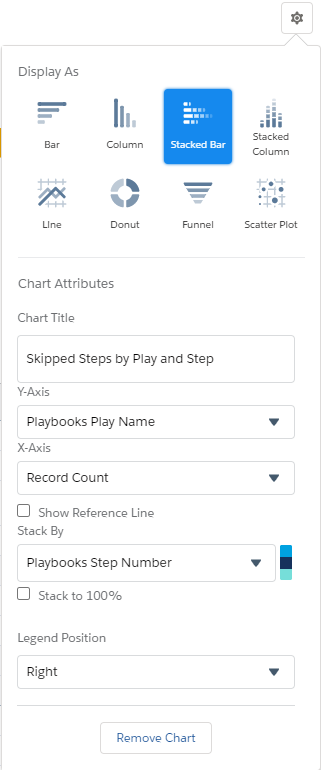
Skipped Steps by Play and Step
“Which Play Steps are users skipping?”
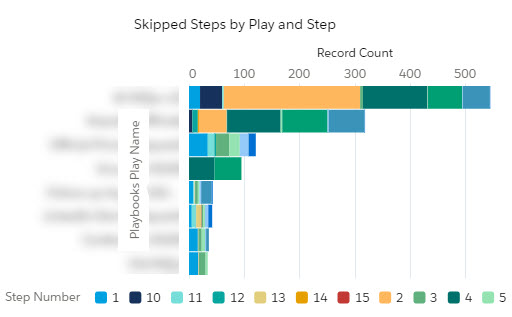
After implementing a new Play strategy, managers and ops teams want to know which steps the team are regularly skipping. This could point to issues with timing, messaging, or something else. Investigate excessive skipping by interviewing reps, then adjust the Play. Not making changes to the Play may lead to Play apathy and discourage reps from using the Play.