Salesforce Reports: Email Outcome Reports
How Effective Are Your Emails
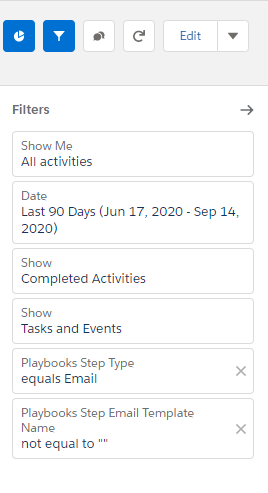
The Email Outcome Reports give deeper insight than how many emails a rep or team is sending. These reports allow a manager and operations team to analyze and A/B test subject lines and templates being used by the team. They highlight link clicks, email opens, and email replies, which are all signals of customer engagement. This can provide insight into the effectiveness of different content strategies, and help teams optimize the likelihood of contact with prospects and customers.
Email activity counts will initially have a null value. When a signal of engagement is received, Playbooks updates these fields with numerical values. Note: In some cases, emails will show a 0 open count, even though the customer has engaged with the email. This most commonly happens when the tracking pixel isn’t downloaded by the recipient because images are blocked by their email, but they clicked the link. In this instance, Playbooks would populate link click data and link clicked count while simultaneously pushing a 0 for the email open.
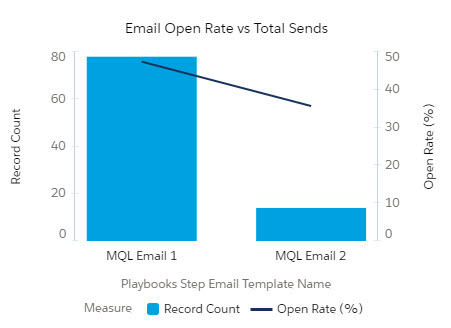
Email Open Rate Trend
“How well have your team’s emails been opened over time?”
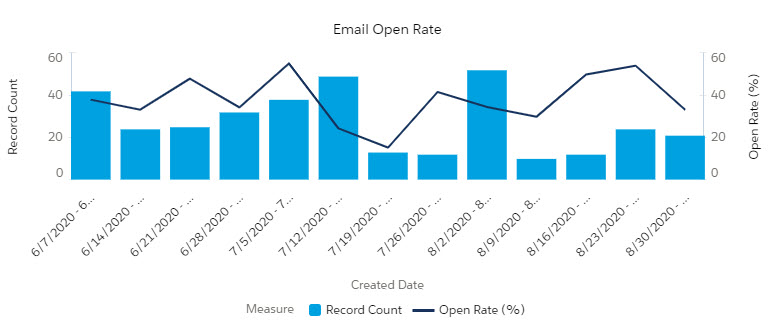
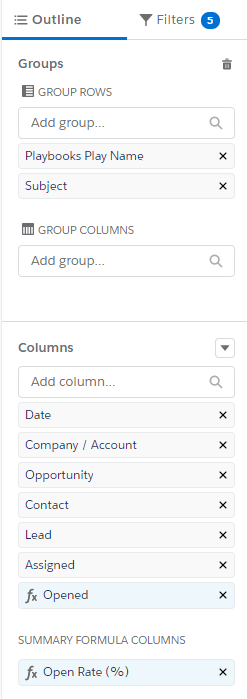
This report provides the average open rate by week as well as the total record count. Dips in open rates should be investigated using the other Email Outcome Reports to confirm issues. Was a new template launched that week? Is there a new content writer in Marketing? Does the subject line need to be improved? Once the cause has been identified, keep an eye on the trend to ensure the solution is working.
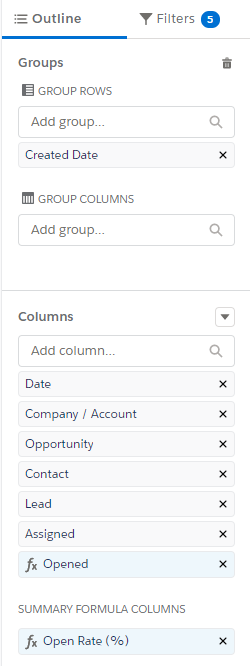
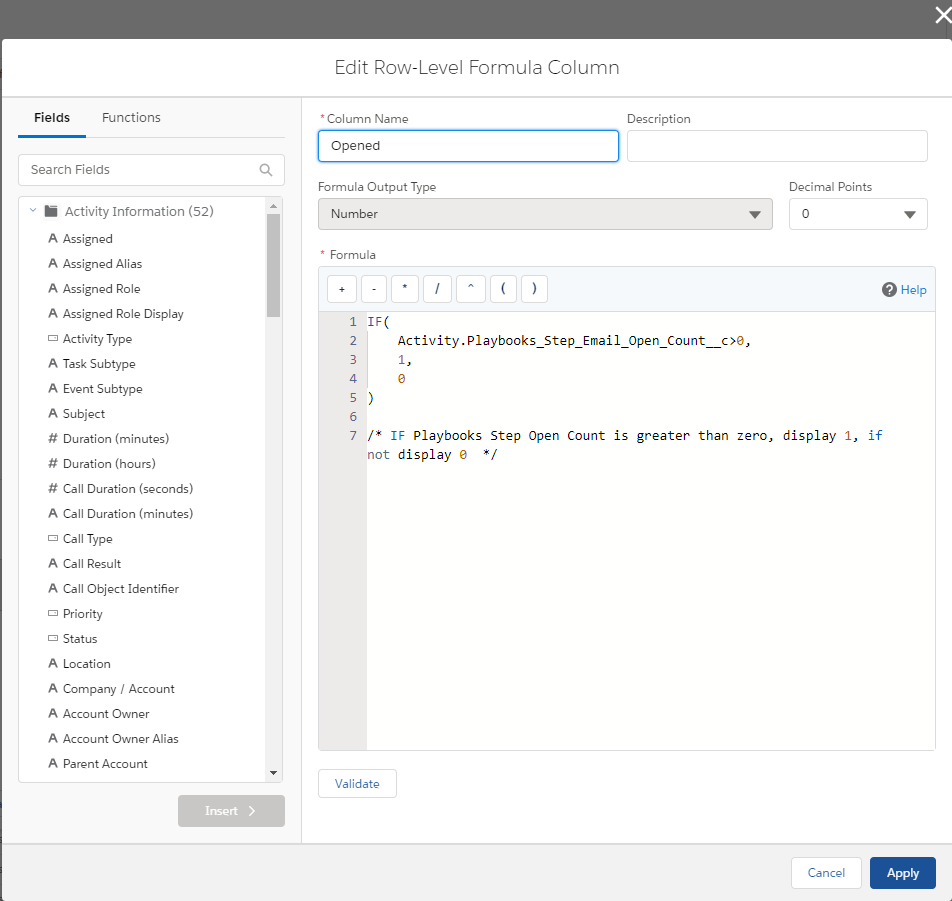
For this report to work correctly, you need to add this formula to the Opened column. Review the code below and click the button to copy the code.
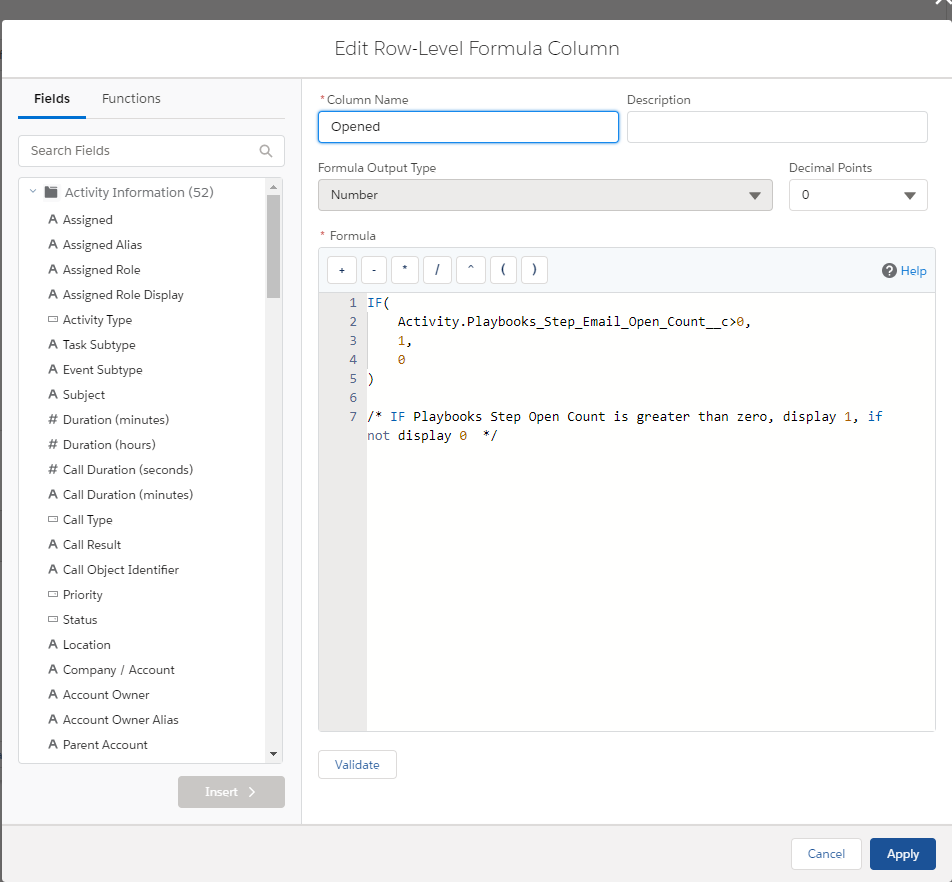
Column Name: Opened
Formula Output Type: Number
Formula:
IF(

Activity.Playbooks_Step_Email_Open_Count__c>0,

1,

0

)


/* IF Playbooks Step Open Count is greater than zero, display 1, if not display 0  */
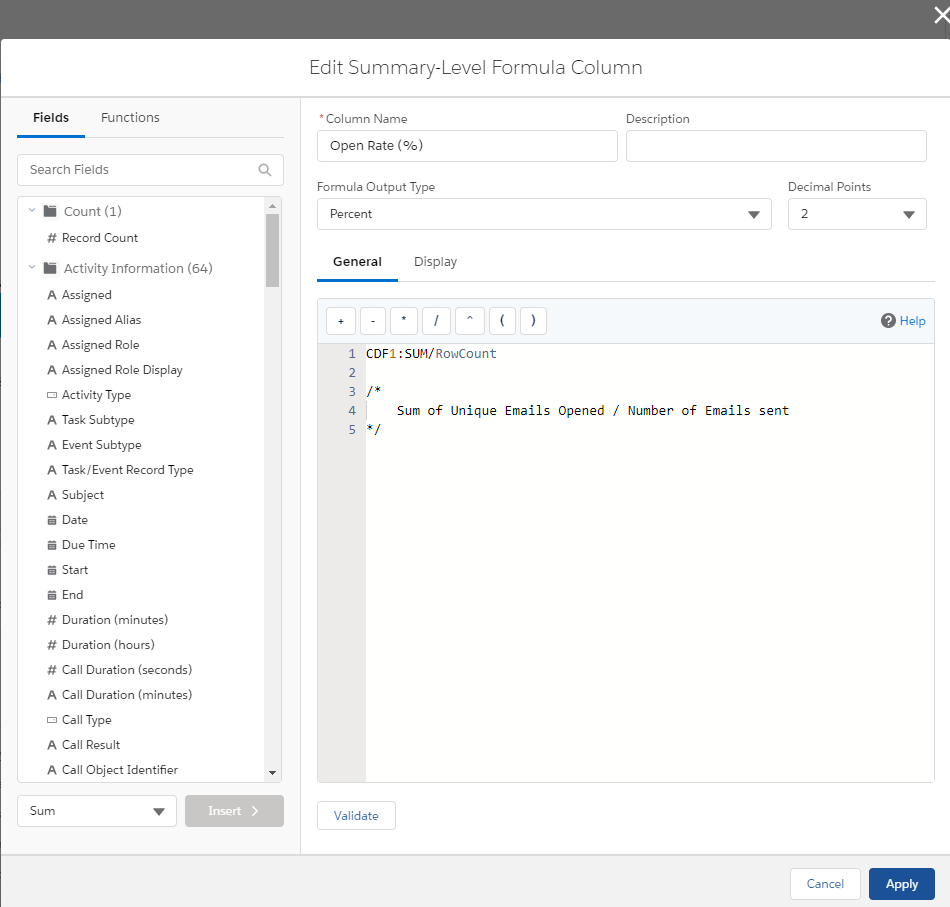
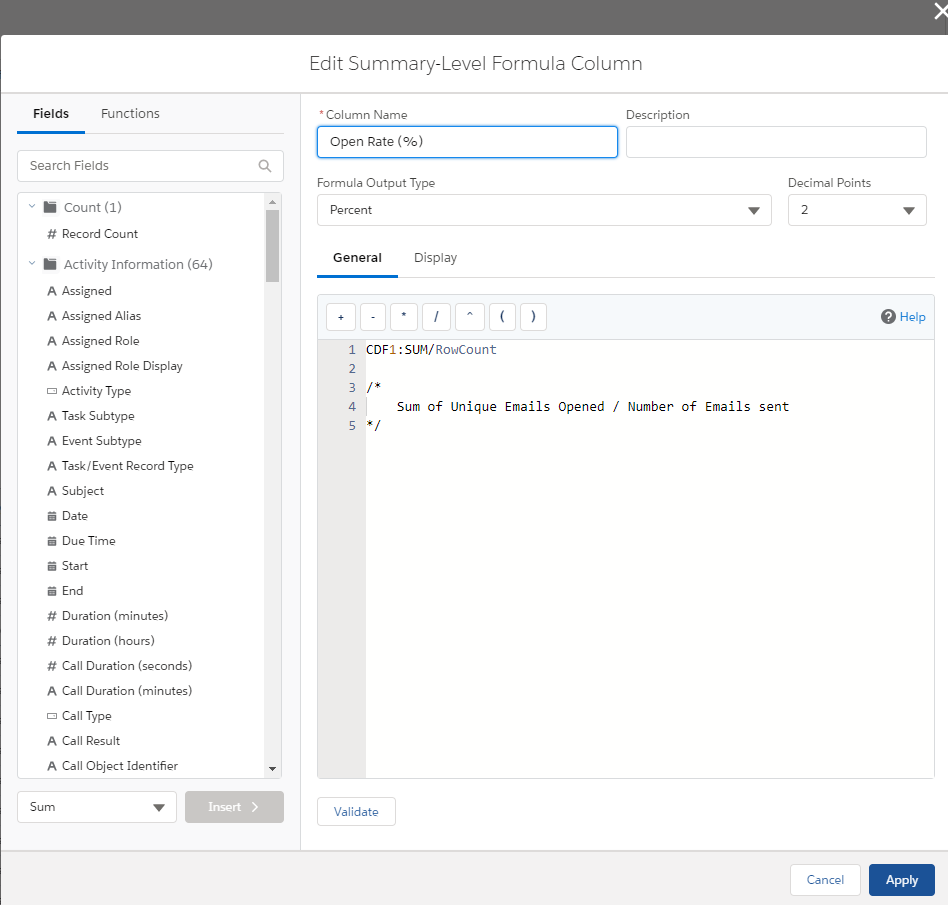
This report requires a second formula in the Open Rate (%) column. Review the code below and click the button to copy the code.
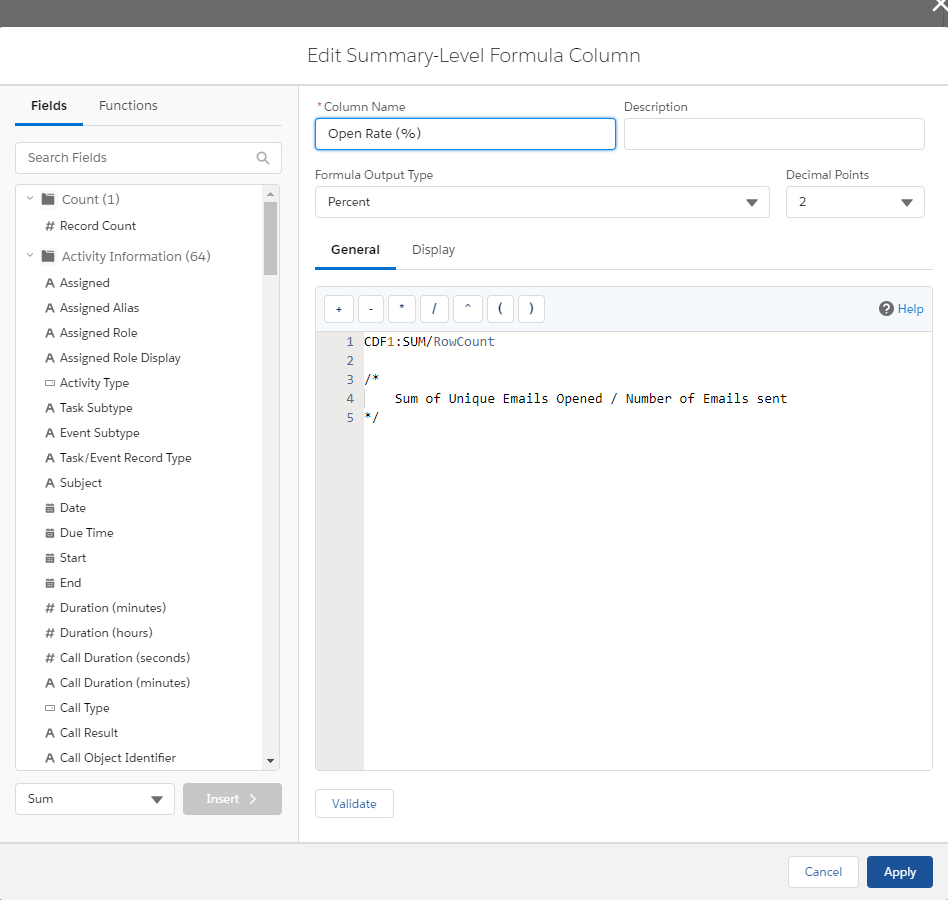
Column Name: Open Rate (%)
Formula Output Type: Percent
Formula:
CDF1:SUM/RowCount


/*

Sum of Unique Emails Opened / Number of Emails sent

*/
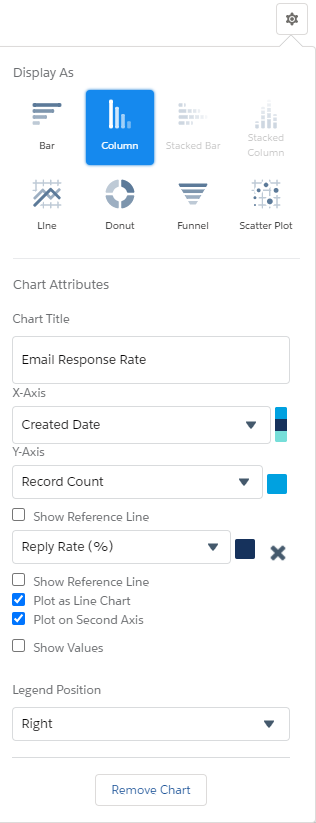
Email Response Rate Trend
“How well have your team’s emails been responded over time?”
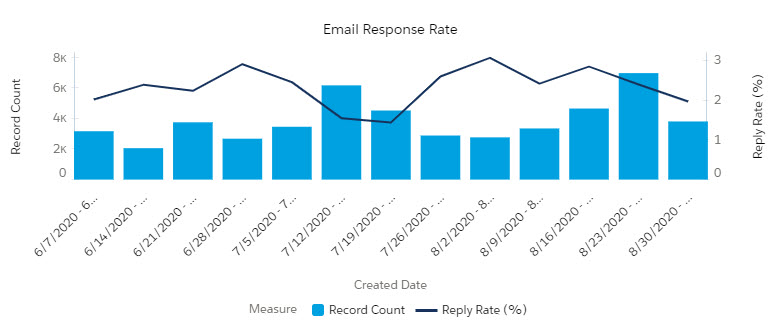
This report tracks how often an outbound email receives a response. After opening an email, did your prospects and customers respond to your email? Was the call to action strong enough to illicit a reply? This data can help to identify which messages are most effective. Assess the content to determine what best practices can be shared throughout your team.
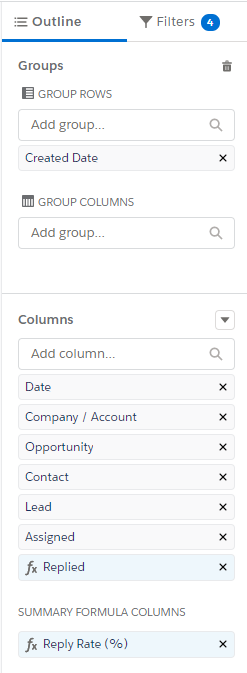
For this report to work correctly, you need to add this formula to the Replied column. Review the code below and click the button to copy the code.
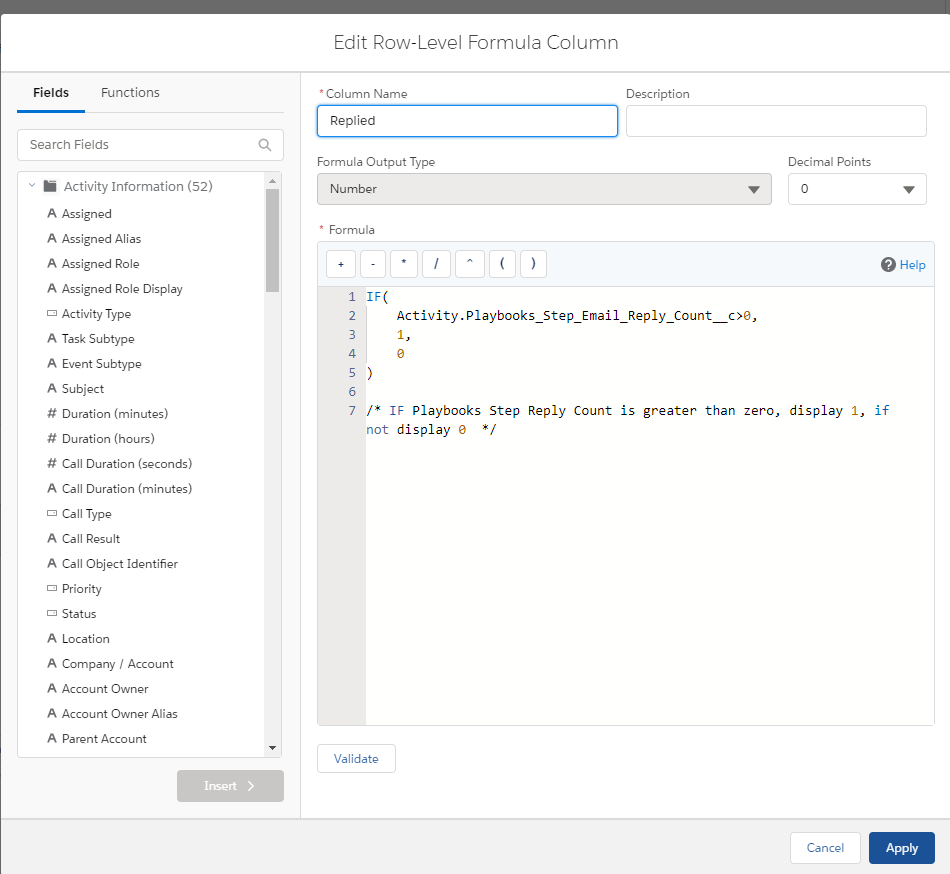
Column Name: Replied
Formula Output Type: Number
Formula:
IF(

Activity.Playbooks_Step_Email_Reply_Count__c>0,

1,

0

)


/* IF Playbooks Step Reply Count is greater than zero, display 1, if not display 0  */
This report requires a second formula in the Replied Rate (%) column. Review the code below and click the button to copy the code.
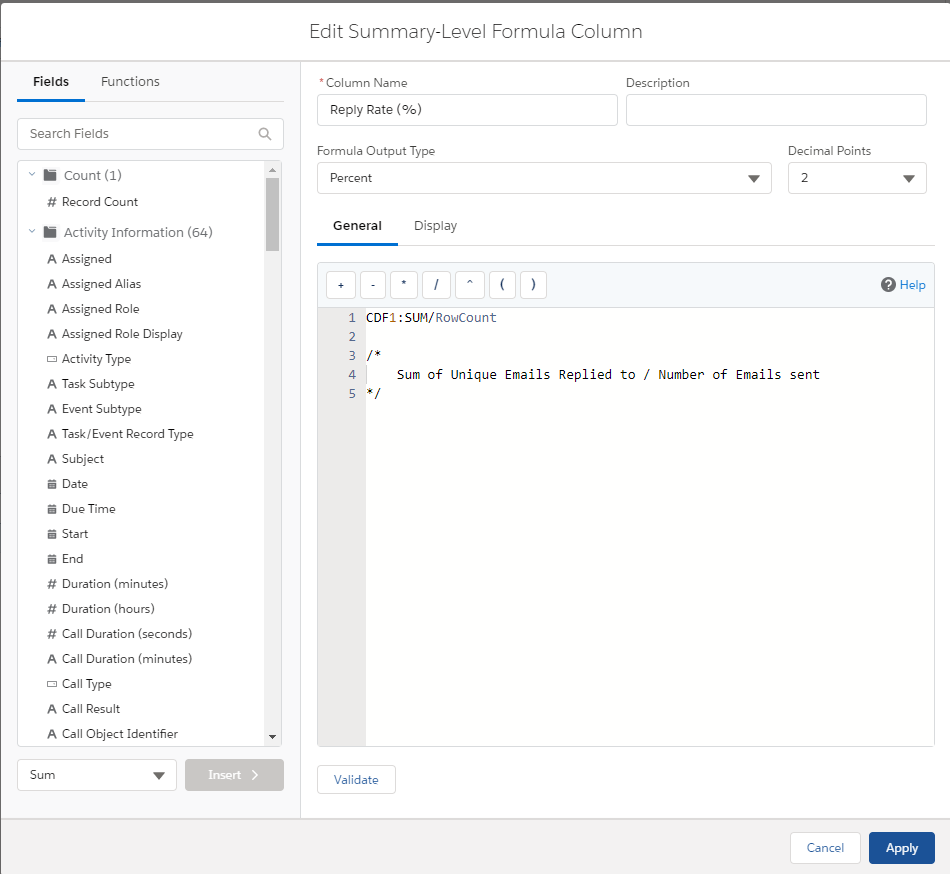
Column Name: Replied Rate (%)
Formula Output Type: Percent
Decimal Points: 2
Formula:
CDF1:SUM/RowCount


/*

Sum of Unique Emails Replied to / Number of Emails sent

*/
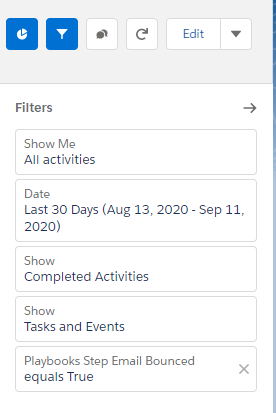
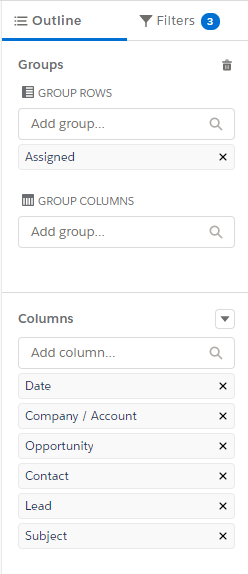
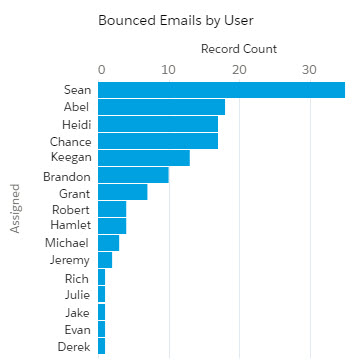
Records with Bounced Email Addresses
“Which records have had emails bounce?”
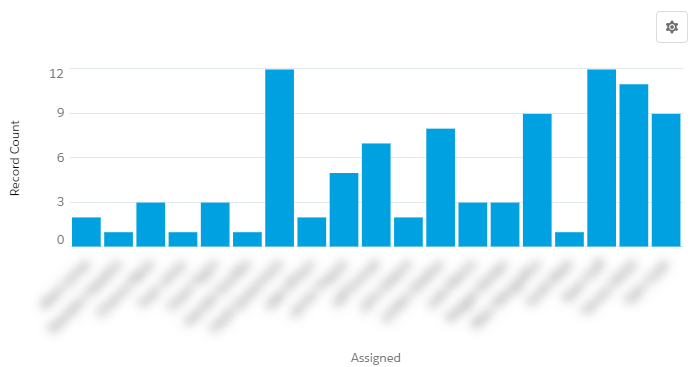
If an email bounces, Playbooks automatically updates the “Playbooks Email Bounced” checkbox. Processes can be built around this checkbox to update other fields in the CRM and alert the Playbooks user.
Large numbers of bounced emails distributed across the whole team could be due to poor quality leads. Managers should benchmark bounced email frequency and seek to identify outliers. Excessive email bounces can have a negative impact on a company’s domain. In some cases, follow up and educate specific sales reps with a high volume of bounced email. In others, your marketing team should be brought in to asses the quality of contact information provided.
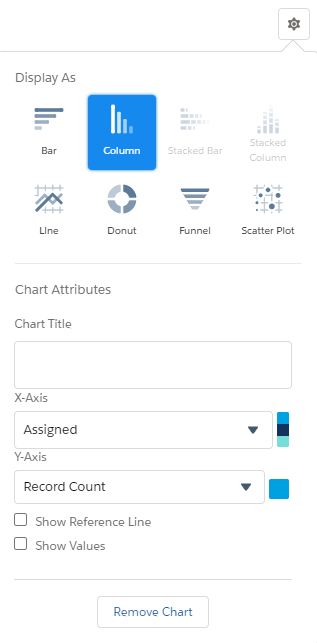
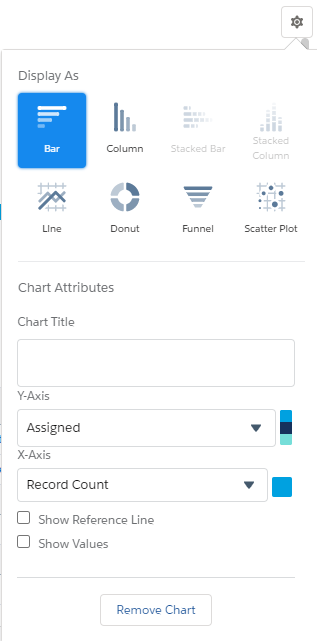
To create this report in a different view, change the Chart Properties to Bar.
Most Popular Email Templates
“Which templates are used the most?”
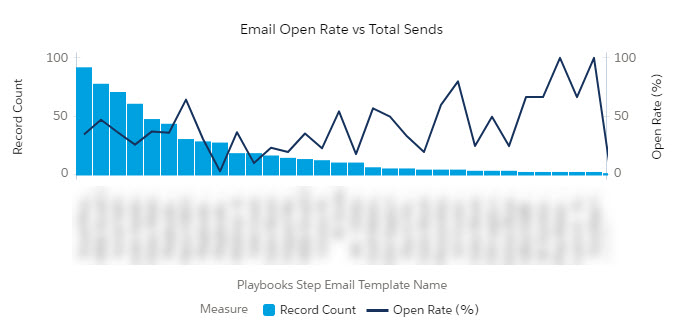
Standardize email messaging by using templates then measure which templates were used the most in the last 30 days. This report includes the open rate % of each template. A manager may be surprised by which template gets the most use or they may have their assumptions about a promising template confirmed. However, don’t be deceived by high open rates for templates sent to only a handful of customers. The sample size may not be large enough to determine if the email is good or just fits a very specific use case well.
For this report to work correctly, you need to add this formula to the Opened column. Review the code below and click the button to copy the code.
Column Name: Opened
Formula Output Type: Number
Formula:
IF(

Activity.Playbooks_Step_Email_Open_Count__c>0,

1,

0

)


/* IF Playbooks Step Open Count is greater than zero, display 1, if not display 0  */
This report requires a second formula in the Open Rate (%) column. Review the code below and click the button to copy the code.

Column Name: Open Rate (%)
Formula Output Type: Percent
Decimal Points: 2
Formula:
CDF1:SUM/RowCount


/*

Sum of Unique Emails Opened / Number of Emails sent

*/
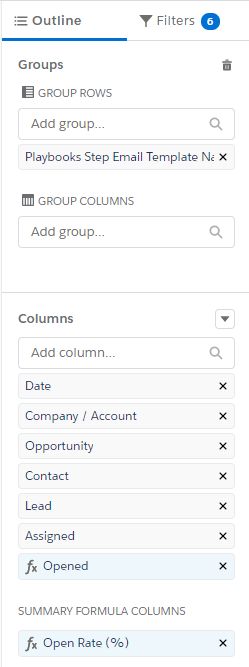
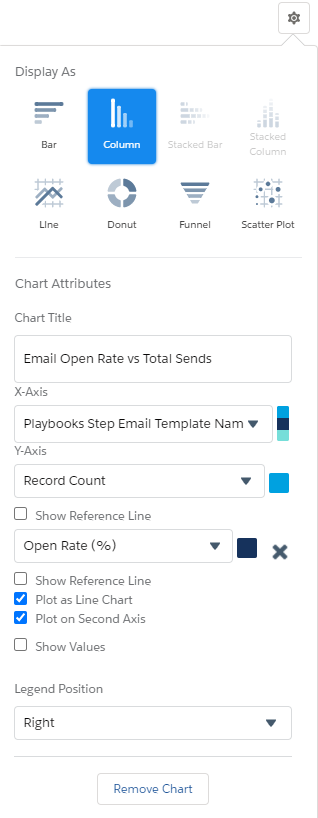
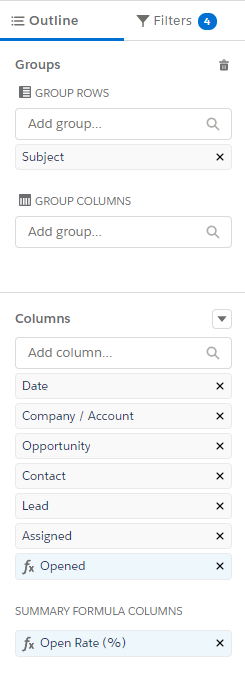
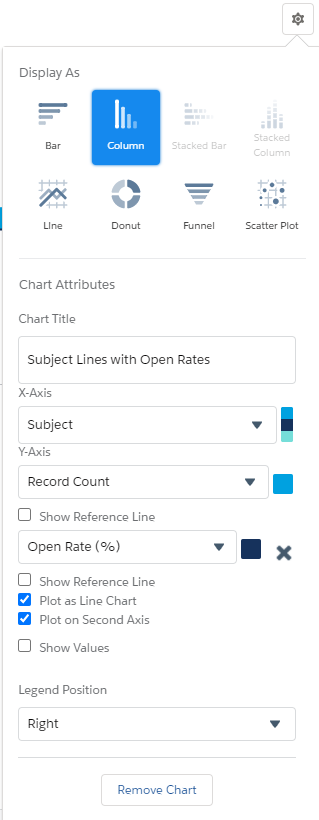
Most Popular Subject Lines
“Which subject lines are used the most?”
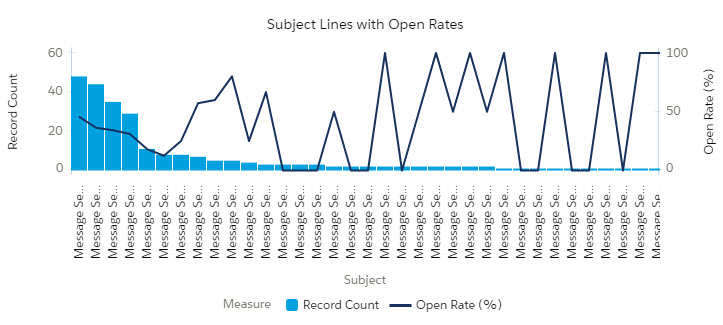
Find out which subject lines are used the most. This report overlays the open rate for added insight. Determine if subject line best practices are being applied or if there’s room for improvement.
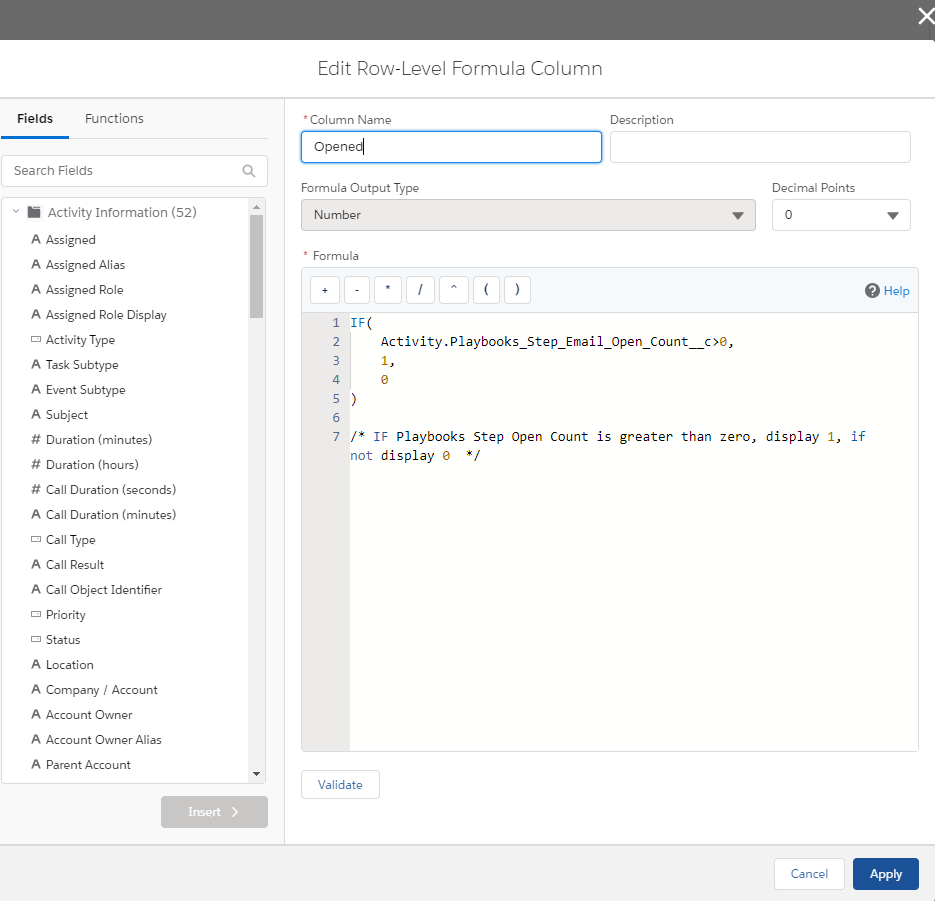
For this report to work correctly, you need to add this formula to the Opened column. Review the code below and click the button to copy the code.
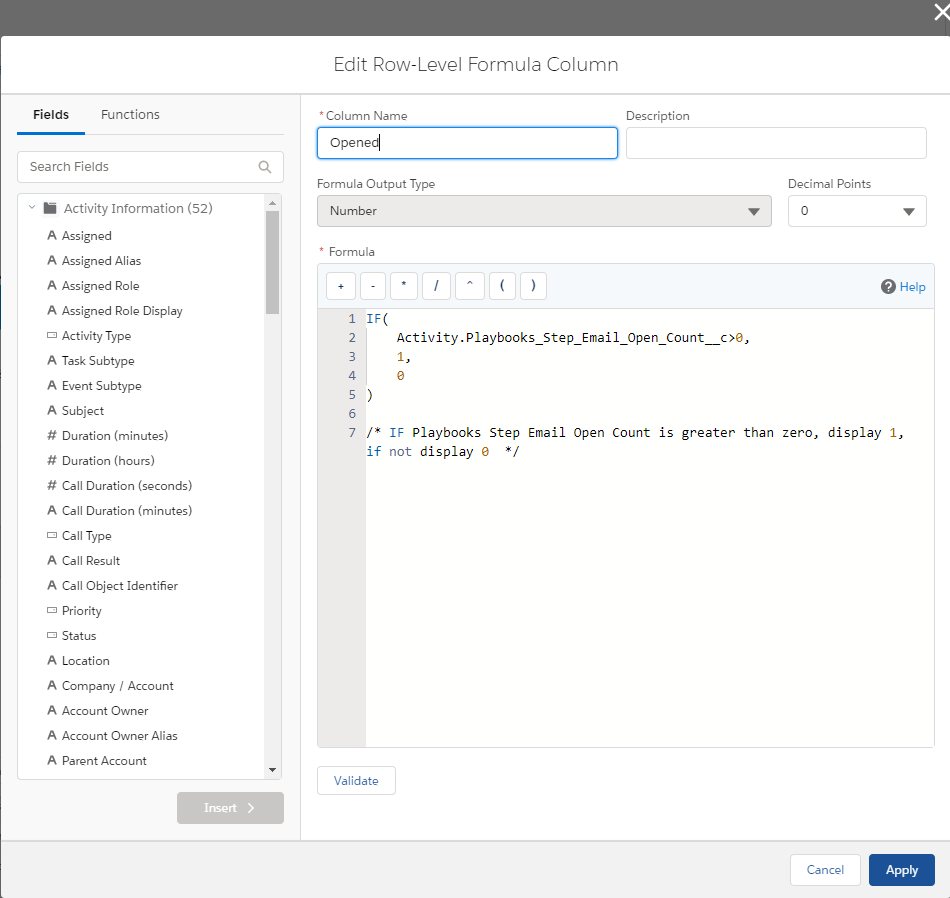
Column Name: Opened
Formula Output Type: Number
Formula:
IF(

Activity.Playbooks_Step_Email_Open_Count__c>0,

1,

0

)


/* IF Playbooks Step Email Open Count is greater than zero, display 1, if not display 0  */
This report requires a second formula in the Open Rate (%) column. Review the code below and click the button to copy the code.
Column Name: Open Rate (%)
Formula Output Type: Percent
Decimal Points: 2
Formula:
CDF1:SUM/RowCount


/*

Sum of Unique Emails Opened / Number of Emails sent

*/
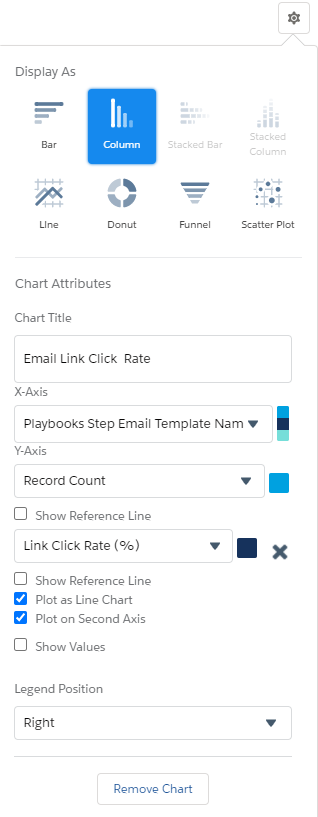
Email Link Click Rate by Template
“Which templates have the best call to action? Good Call to Action = more link clicks”
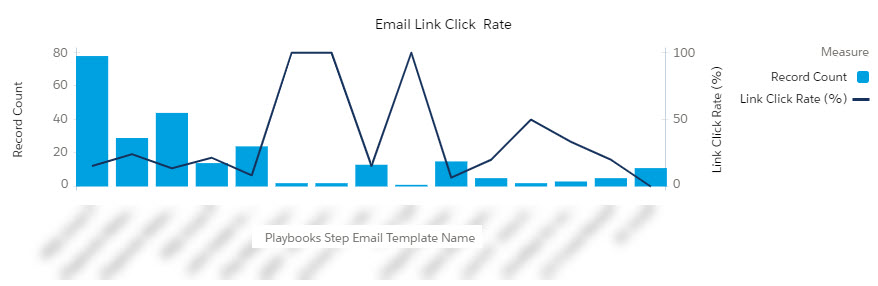
As an email best practice, links are valuable because they indicate the prospect is engaging with your email, interested, and wants to know more. Track how effective the links in your emails are with this report. Decide if you need better wording to drive customers to click the link or if the current strategy is working.
For this report to work correctly, you need to add this formula to the Link Clicked column. Review the code below and click the button to copy the code.
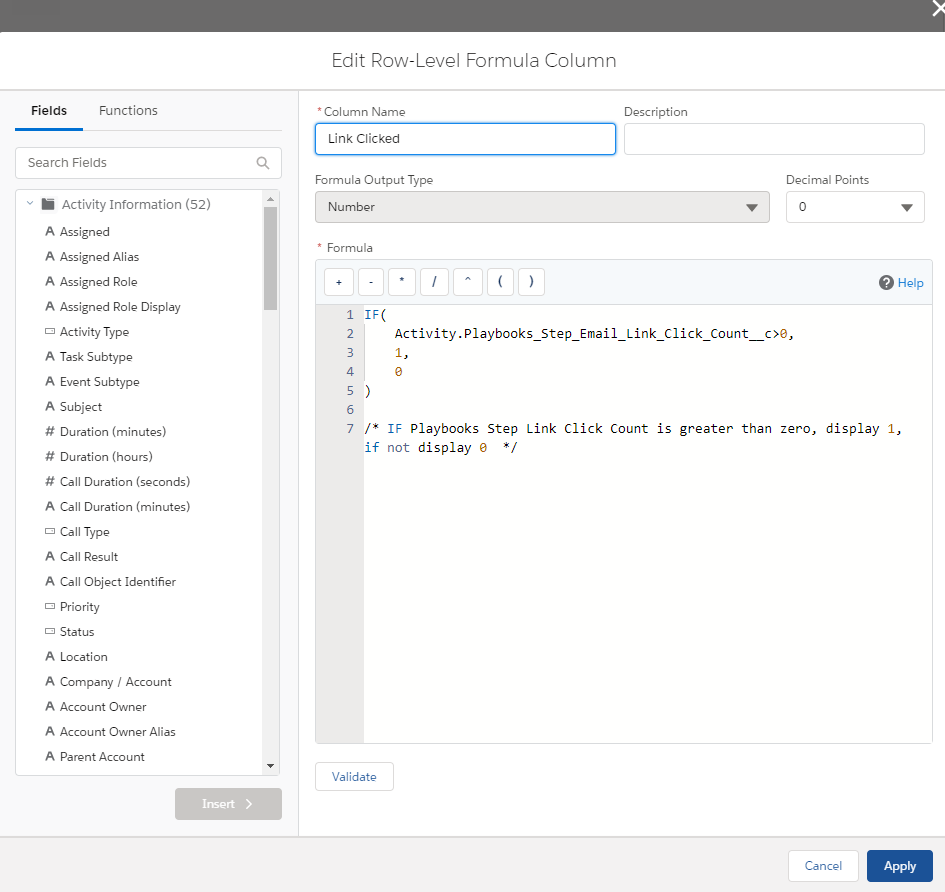
Column Name: Linked Clicked
Formula Output Type: Number
Formula:
IF(

Activity.Playbooks_Step_Email_Link_Click_Count__c>0,

1,

0

)


/* IF Playbooks Step Link Click Count is greater than zero, display 1, if not display 0  */
This report requires a second formula in the Link Click Rate (%) column. Review the code below and click the button to copy the code.

Column Name: Link Click Rate (%)
Formula Output Type: Percent
Decimal Points: 2
Formula:
CDF1:SUM/RowCount


/*

Sum of Unique Emails with a link click / Number of Emails sent

*/
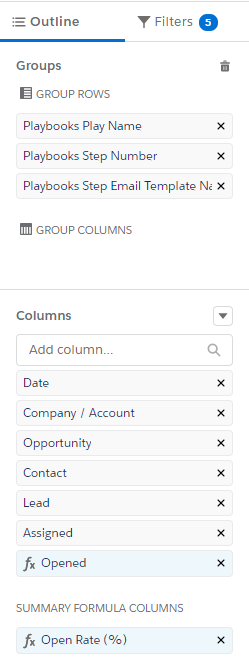
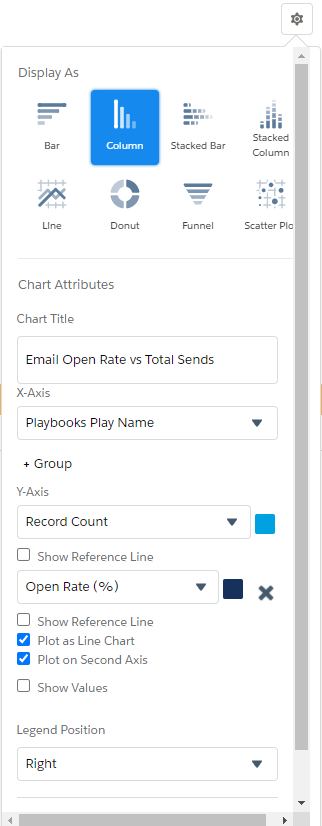
A/B Test – Template by Play and Step
“Which Templates produce better open rates in different situations?”
Test an email template against another to see which is the best approach for reaching out to customers. Create an A/B test for email templates being used in a Play, then track open rates with this report.
For this report to work correctly, you need to add this formula to the Opened column. Review the code below and click the button to copy the code.

Column Name: Opened
Formula Output Type: Number
Formula:
IF(

Activity.Playbooks_Step_Email_Open_Count__c>0,

1,

0

)


/* IF Playbooks Step Open Count is greater than zero, display 1, if not display 0  */
This report requires a second formula in the Open Rate (%) column. Review the code below and click the button to copy the code.

Column Name: Open Rate (%)
Formula Output Type: Percent
Decimal Points: 2
Formula:
CDF1:SUM/RowCount


/*

Sum of Unique Emails Opened / Number of Emails sent

*/
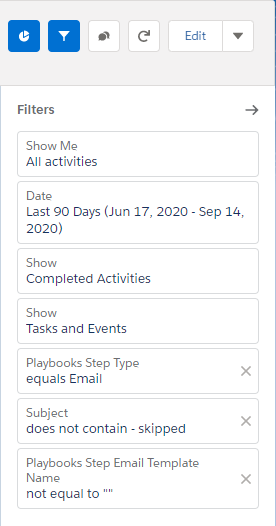
A/B Test – Subject Lines
“Which Subject lines produce better open rates in different situations?”
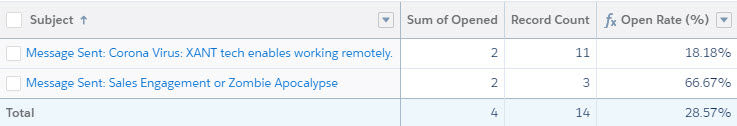
Test out which subject line is more eye catching with this report. Be sure to use the same email body text to ensure the results are not due to some outside factor. If the subject lines have customizations, you may need to filter the emails by template first as subjects with customer customizations can be put in different buckets.
For this report to work correctly, you need to add this formula to the Opened column. Review the code below and click the button to copy the code.
Column Name: Opened
Formula Output Type: Number
Formula:
IF(

Activity.Playbooks_Step_Email_Open_Count__c>0,

1,

0

)


/* IF Playbooks Step Open Count is greater than zero, display 1, if not display 0  */
This report requires a second formula in the Open Rate (%) column. Review the code below and click the button to copy the code.
Column Name: Open Rate (%)
Formula Output Type: Percent
Decimal Points: 2
Formula:
CDF1:SUM/RowCount


/*

Sum of Unique Emails Opened / Number of Emails sent

*/