Salesforce Reports: Call Outcome Reports
How Effective are your Outgoing Calls
Call Outcomes hold important information about your current call strategies, but you must be careful in how you interpret the results. Just knowing how many calls a rep or team has made does not lead to advanced strategy or ROI calculations. To help supplement this base data, Playbooks and its users log other insights about the call to help answer some of the top questions managers and operation teams have.
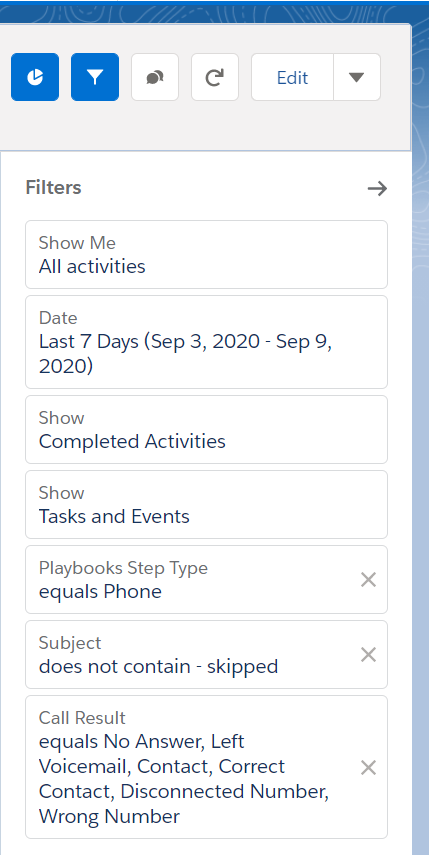
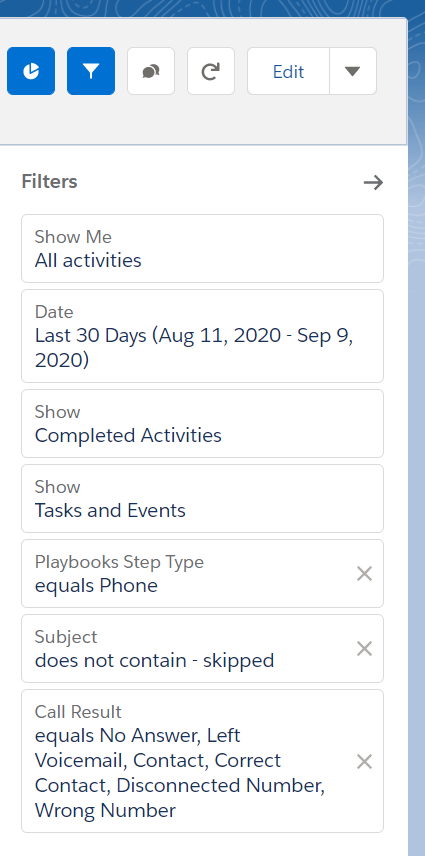
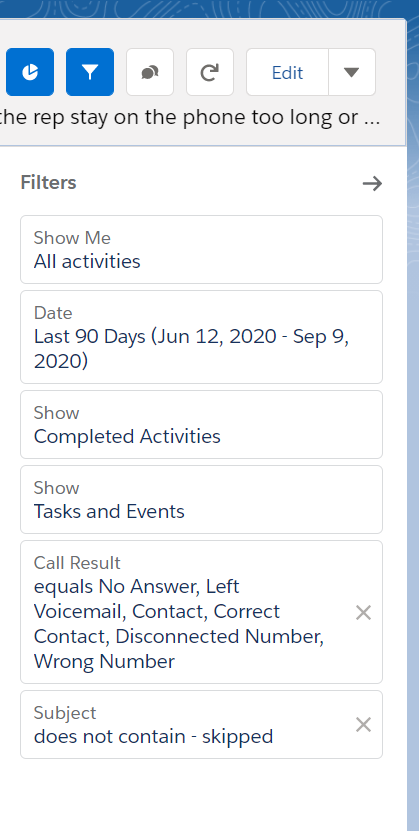
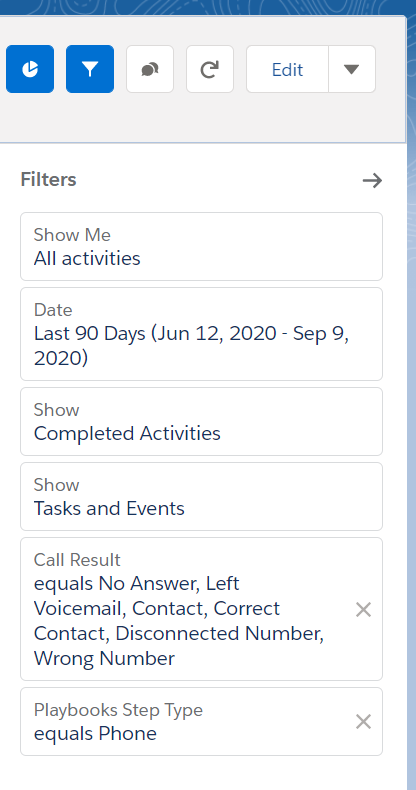
Many of the reports in this folder use the standard Salesforce “Call Result” field. The Playbooks integration means that every call placed through Playbooks must have a Call Result. Some customers require other fields to be completed after each call. For Playbooks reports, Phone Call fields refer to calls placed in Playbooks. Call Activity fields refer to skipped calls meaning there isn’t a phone call record. The Call Activity fields will not appear in the reports that use the filter “Subject: does not contain -Skipped”. Making things easy and seamless means that your data represents a full accounting of call tasks.
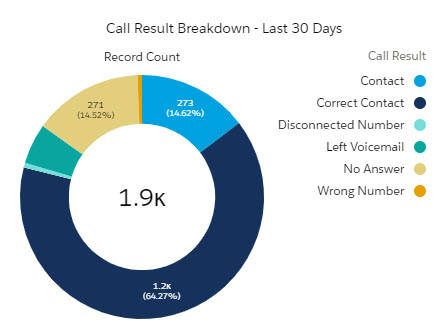
Call Results Breakdown
“How many calls were logged with each call disposition option?”
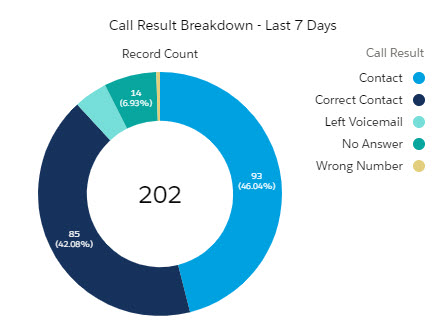
This report and graph show a rep and/or manager the dispersion of calls in the last 7 days across the different call result options. This report can also be extended to show the last 30 days (see how to create this report in the advanced reporting tab). Use this as a quick snapshot of your users’ call activity.
Change the date range to be for the last 30 days to see this report for the last 30 days.
Call Result Detail View
“What does my rep do with their talk time?”
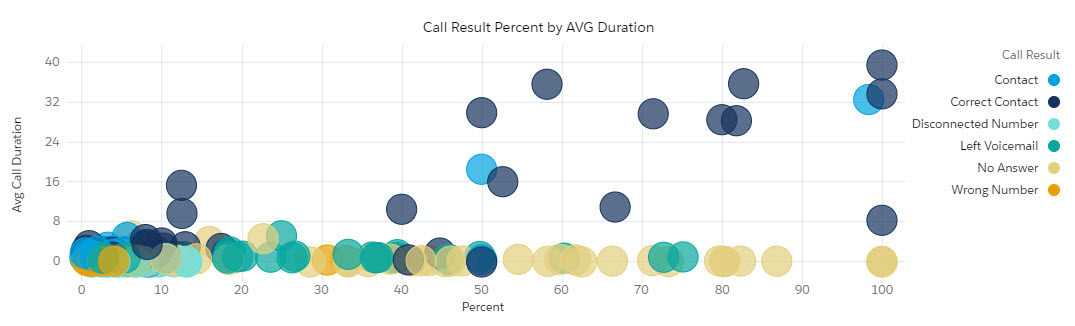
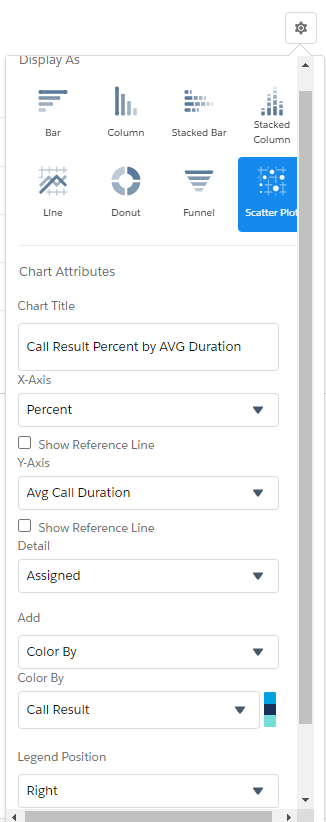
This report plots your users’ Call Results on a plot map using the percentage of total calls as the X axis and average call duration as the Y axis. With this data, a manager:
- Could easily identify if a rep is incorrectly logging an unusually high number of calls with one Call Result (see the 5 dots on the far right where >95% of calls are one call result).
- Would expect to see plot points for Disconnected Number, Wrong Number, and No Answer along the bottom of the plot map indicating that little time was spent on those calls.
- Could identify reps with shorter call durations on Correct Contact calls and coach them on how to keep prospects better engaged now that you’ve got them on the phone.
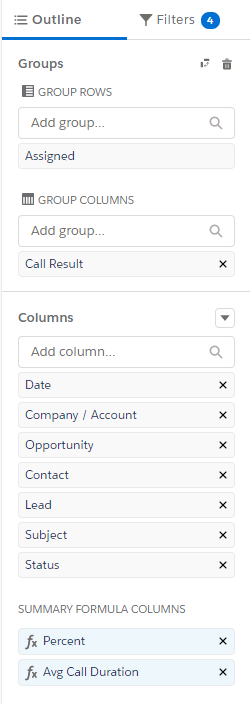
For this report to work correctly, you need to add this formula to the Percent column. Review the code below and click the button to copy the code.
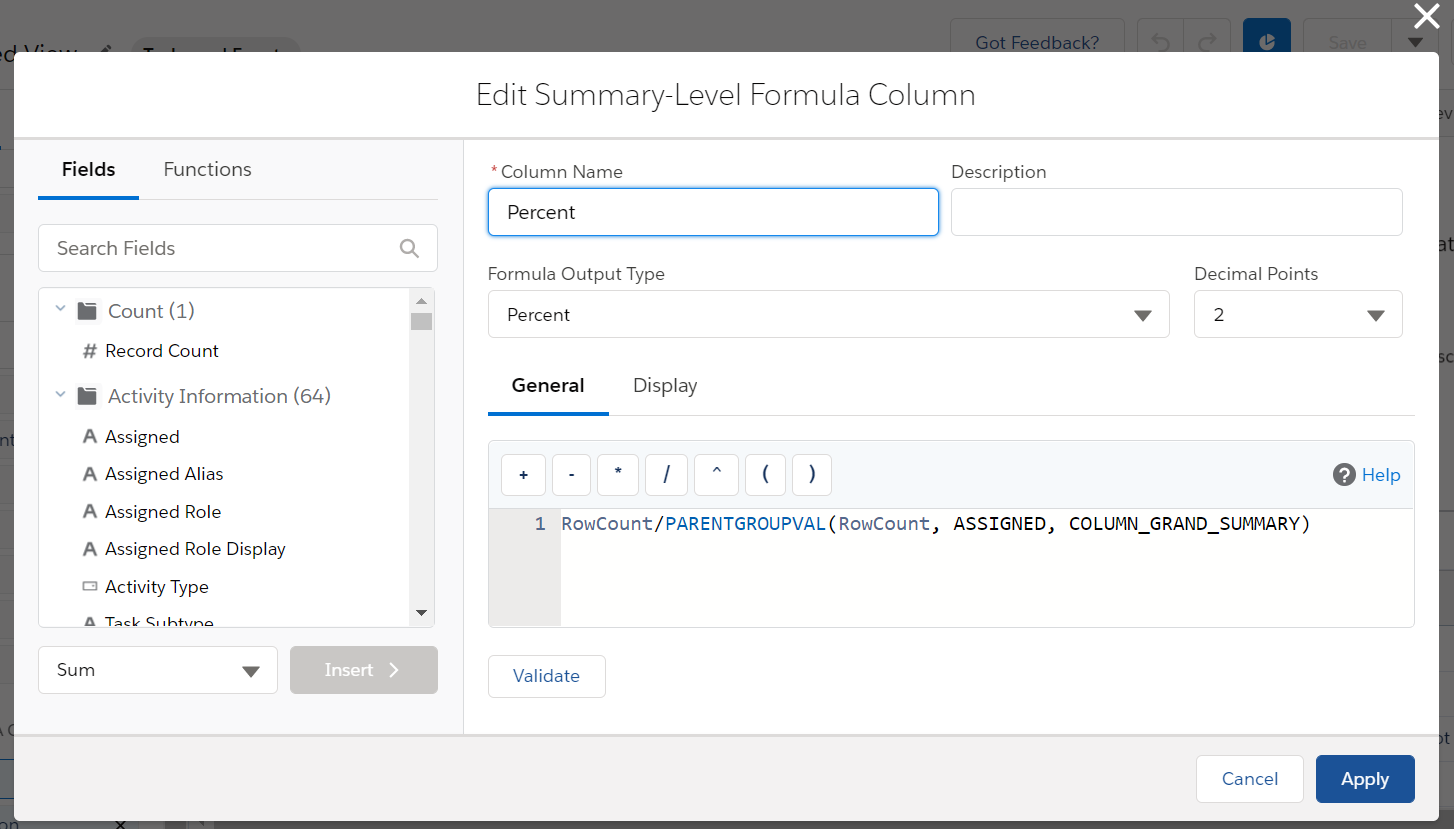
Column Name: Percent
Formula Output Type: Percent
Decimal Points: 2
Formula:
RowCount/PARENTGROUPVAL(RowCount, ASSIGNED, COLUMN_GRAND_SUMMARY)
This report requires a second formula in the Avg Call Duration column. Review the code below and click the button to copy the code.
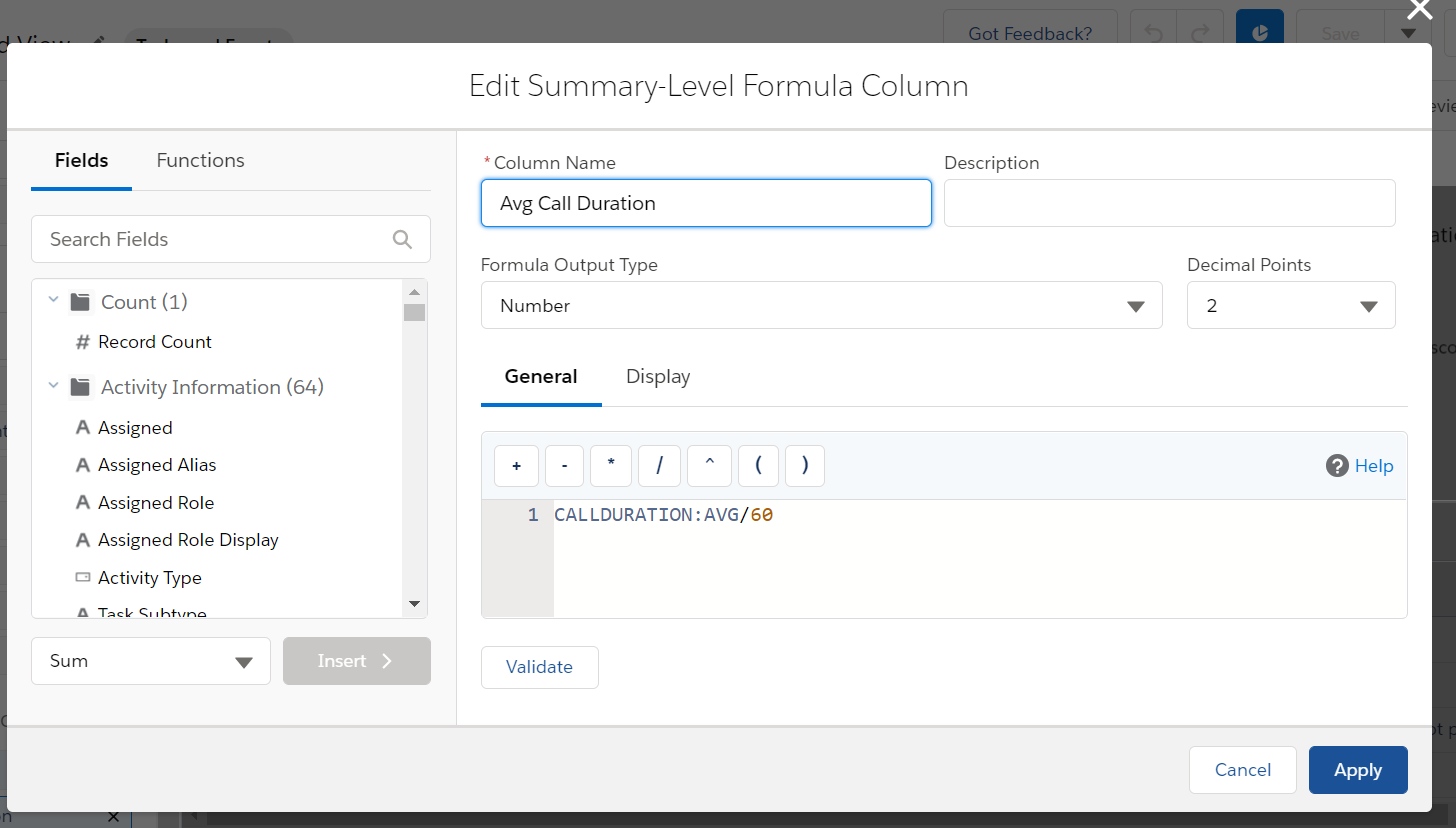
Column Name: Avg Call Duration
Formula Output Type: Number
Decimal Points: 2
Formula:
CALLDURATION:AVG/60
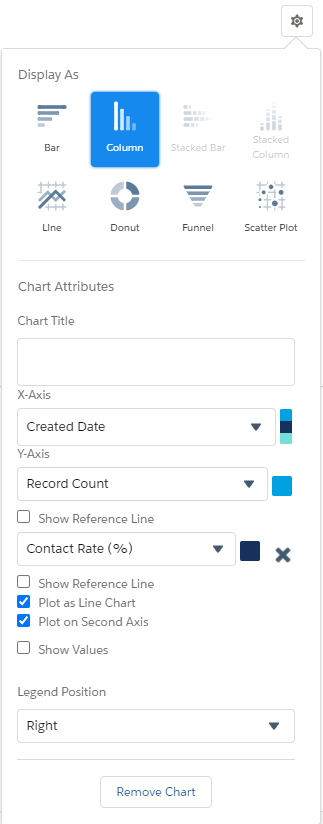
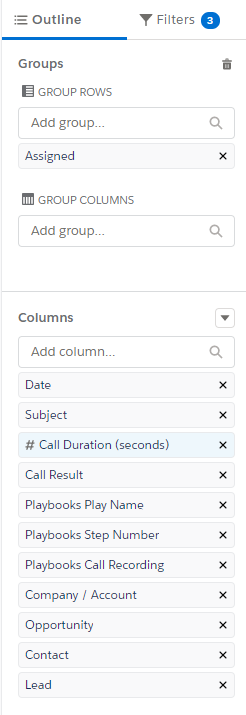
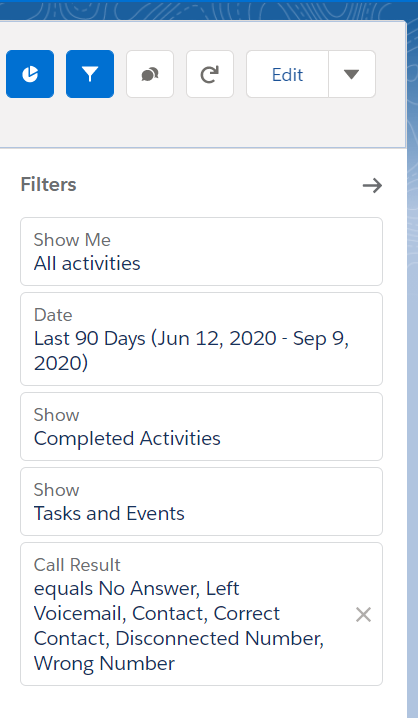
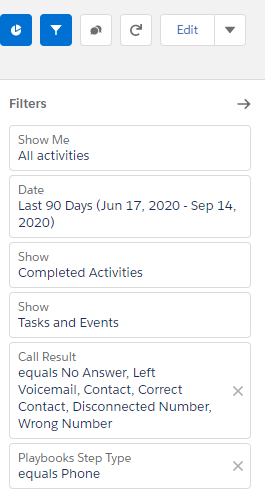
Contact Rate Trending – Last 90 Days
“What is my rep’s rate on outbound calls for the last 90 days?”
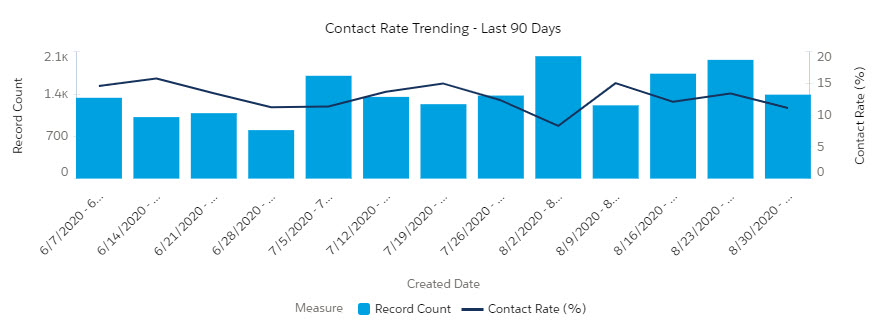
View the overall contact rate for the team over the LAST 90 DAYS. Use this report to track fluctuations in contact rates. Be sure to analyze if dips are caused by holidays, new lead sources, or positive/negative changes in process.
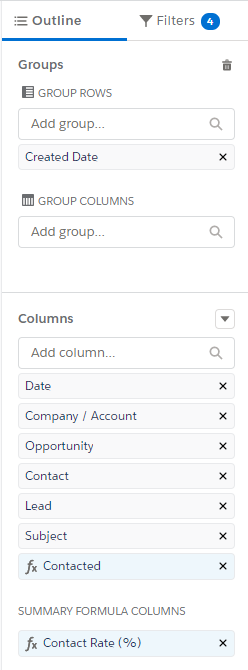
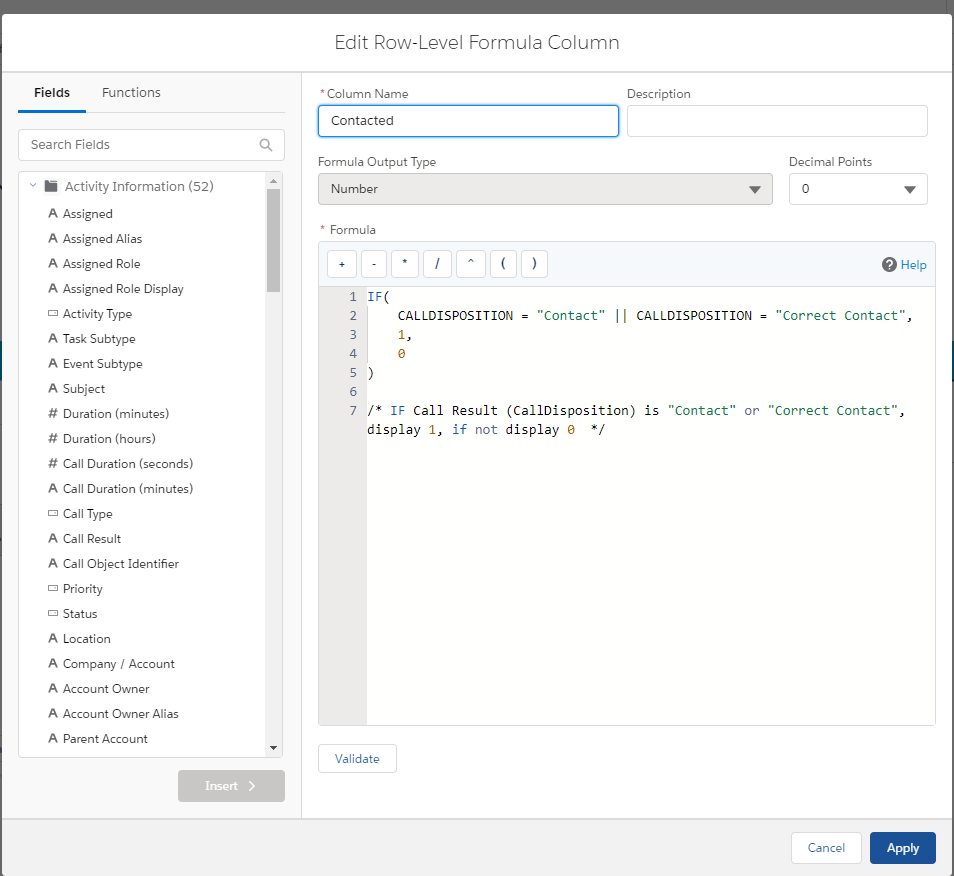
For this report to work correctly, you need to add this formula to the Contacted column. Review the code below and click the button to copy the code.
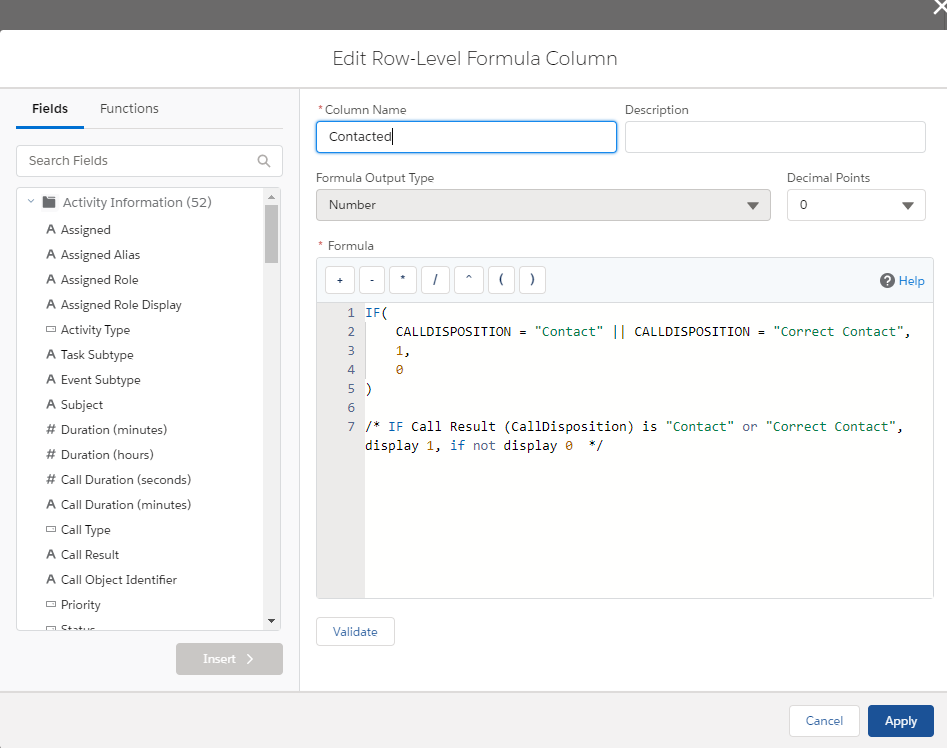
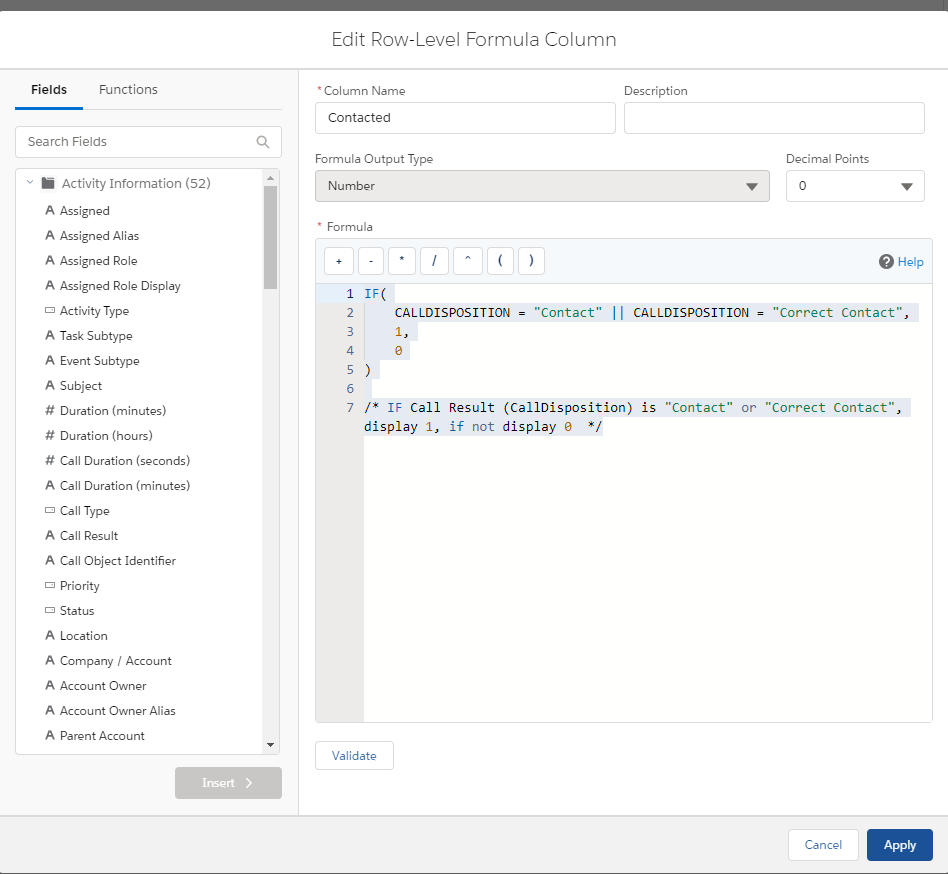
Column Name: Contacted
Formula Output Type: Number
Formula:
IF(

CALLDISPOSITION = "Contact" || CALLDISPOSITION = "Correct Contact",

1,

0

)

/* IF Call Result (CallDisposition) is "Contact" or "Correct Contact", display 1, if not display 0  */
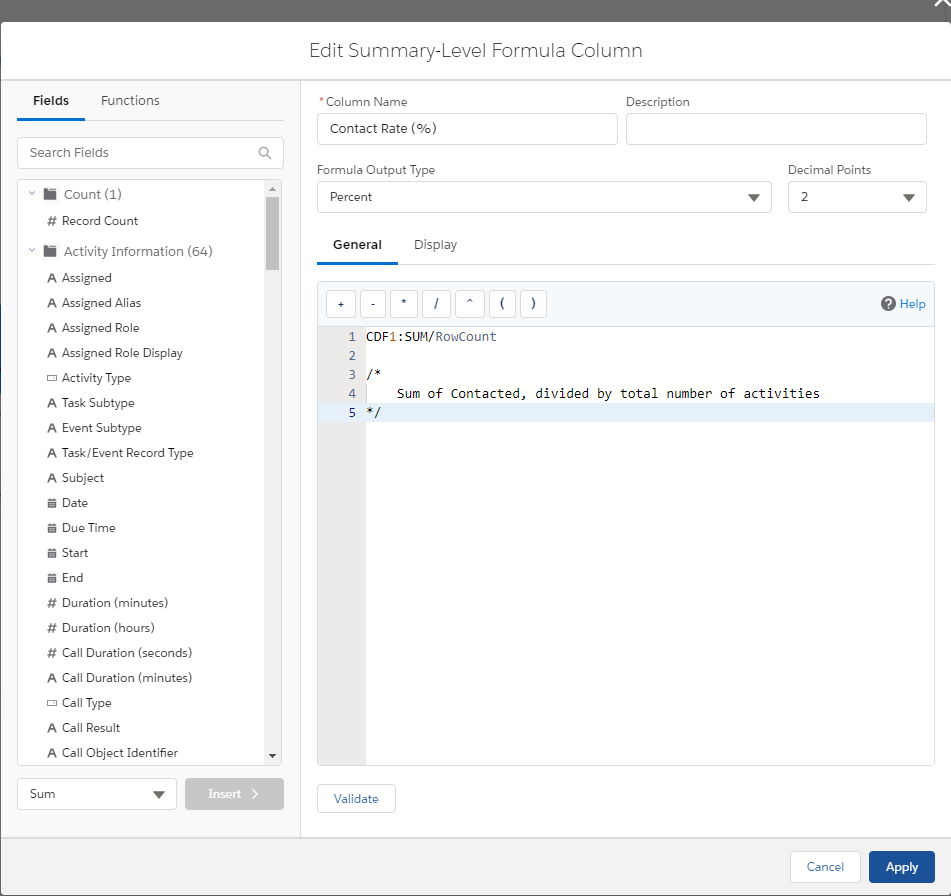
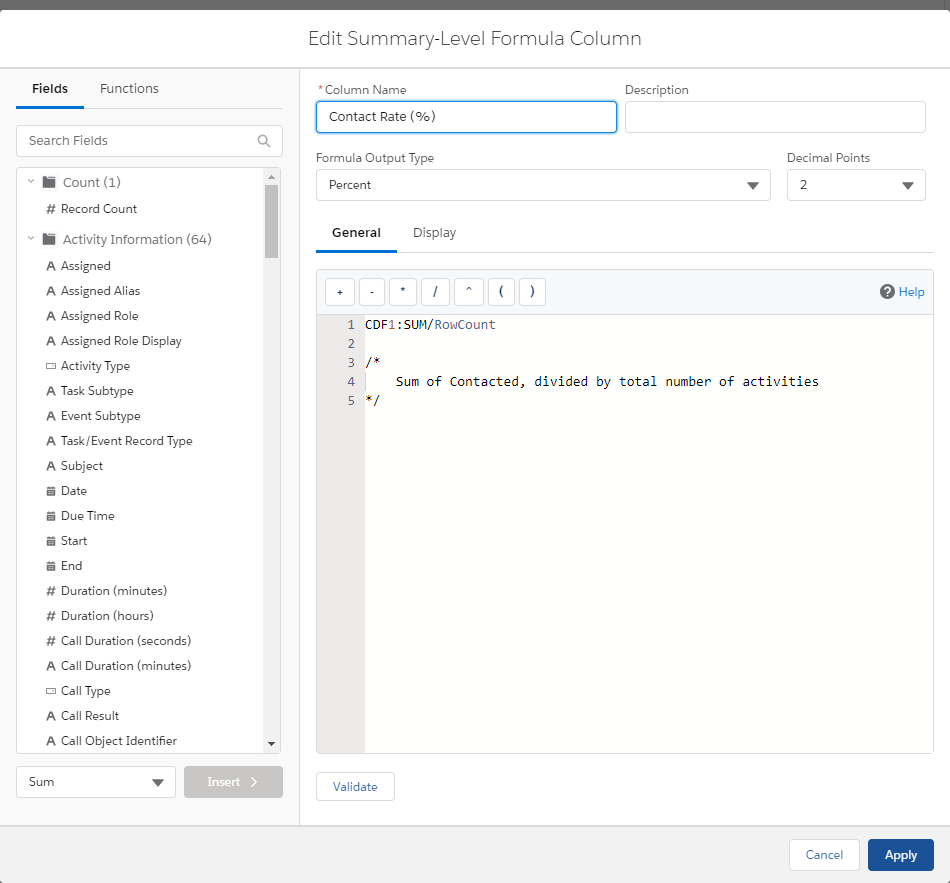
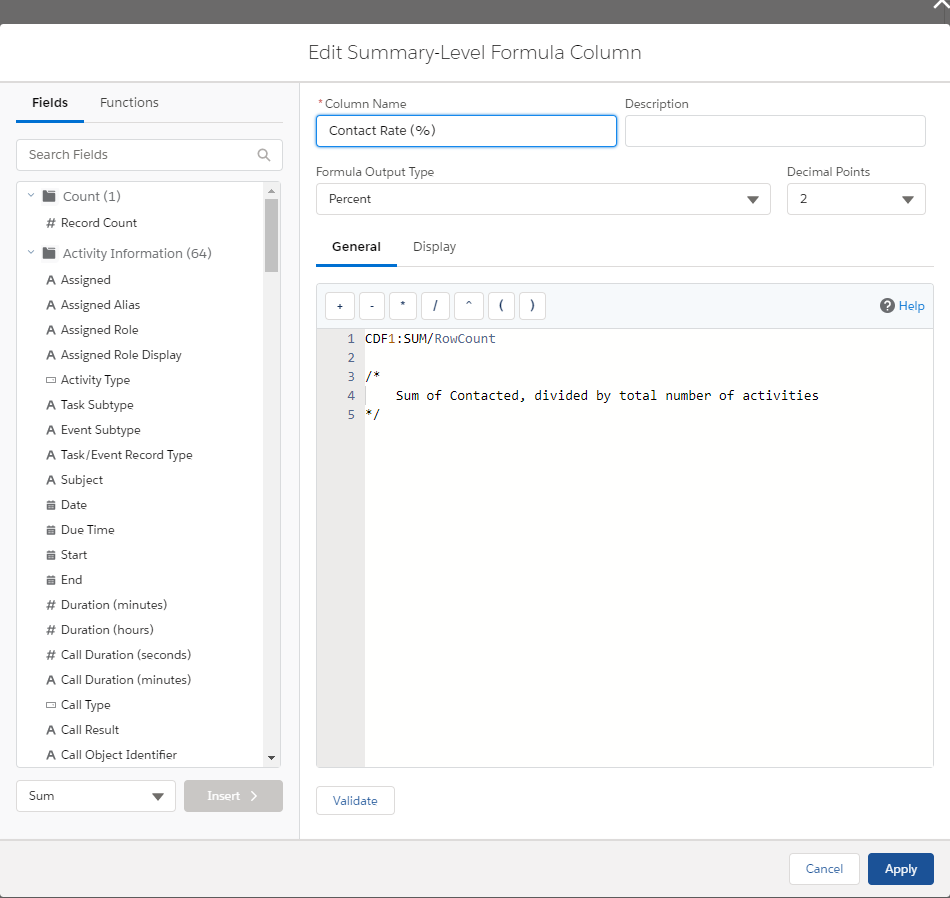
This report requires a second formula in the Contact Rate (%) column. Review the code below and click the button to copy the code.
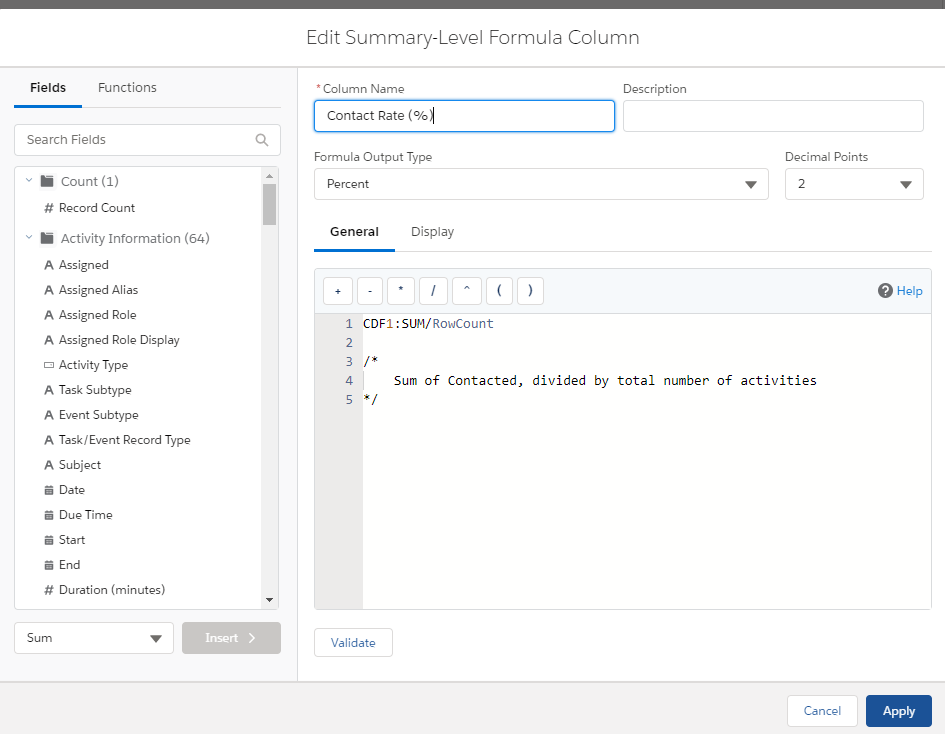
Column Name: Contact Rate (%)
Formula Output Type: Percent
Decimal Points: 2
Formula:
CDF1:SUM/RowCount

/*

Sum of Contacted, divided by total number of activities

*/
Call Recordings Today
“How can I access all my call recordings for the day?”
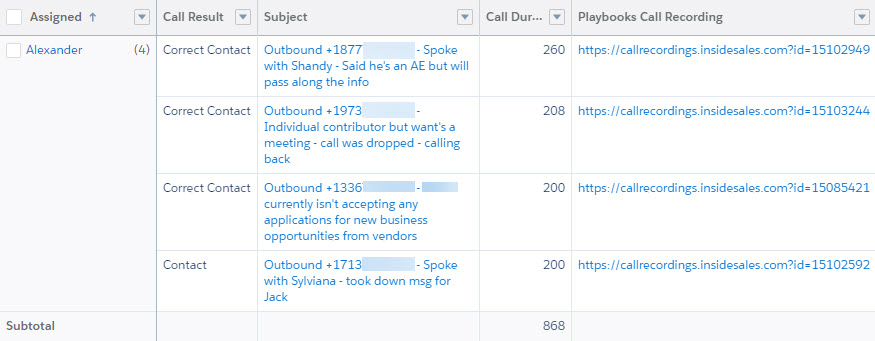
This report is not a traditional report. This report does not have a chart because the individual call recording links are in the details of the report.
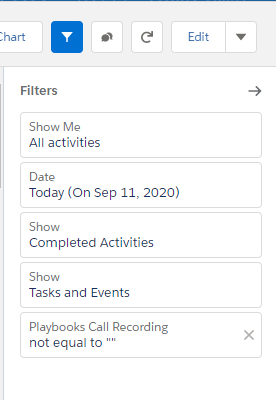
There is no chart for this report. It is only the list of recordings.
Adjust filters to identify the recordings you want:
- Filter for specific users to prepare for a 1:1 coaching session
- Filter by Call Result equals Correct Contact to evaluate calls when the target prospect is on the call.
- Filter by Call Duration to coach reps how to either keep prospects on the call longer or to identify “Gold Star” recordings to share with the whole team.
- Filter by Play Name to confirm approved messaging is being maintained.
Contact Rate by User
“Do certain users have better contact rates than others?”
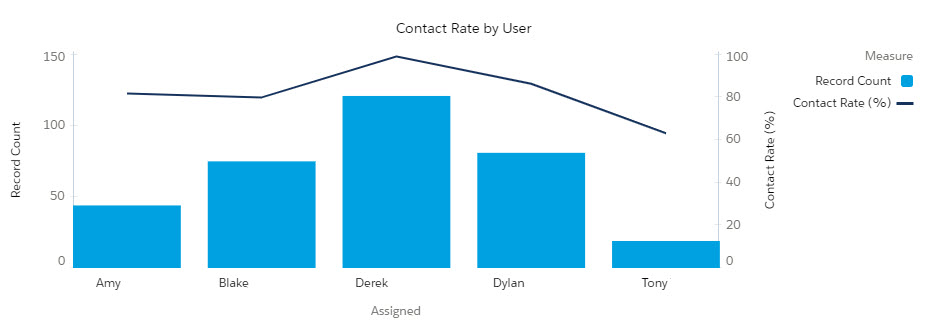
Review how your reps are doing compared to each other. First identify the users who stand out with this report, then study what they do well and determine if it can be replicated with the whole team.
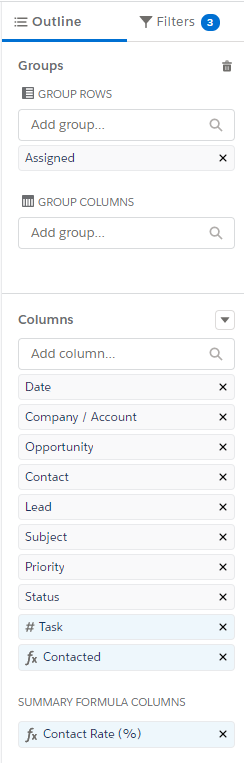
For this report to work correctly, you need to add this formula to the Contacted column. Review the code below and click the button to copy the code.
Column Name: Contacted
Formula Output Type: Number
Formula:
IF(

CALLDISPOSITION = "Contact" || CALLDISPOSITION = "Correct Contact",

1,

0

)


/* IF Call Result (CallDisposition) is "Contact" or "Correct Contact", display 1, if not display 0  */
This report requires a second formula in the Contact Rate (%) column. Review the code below and click the button to copy the code.
Column Name: Contact Rate (%)
Formula Output Type: Percent
Decimal Points: 2
Formula:
CDF1:SUM/RowCount


/*

Sum of Contacted, divided by total number of activities

*/
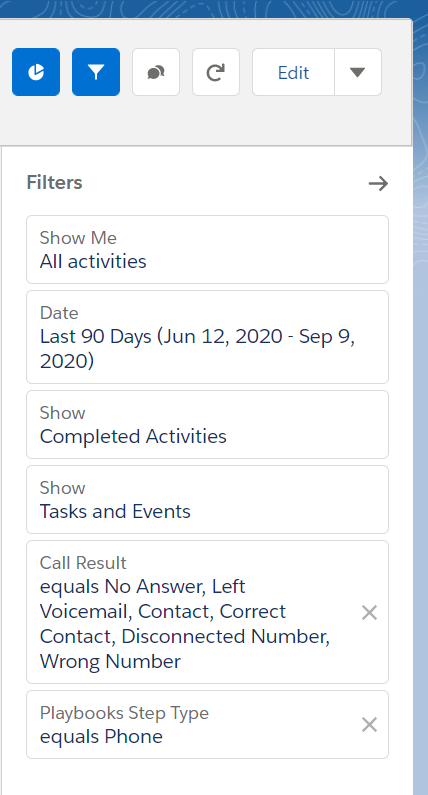
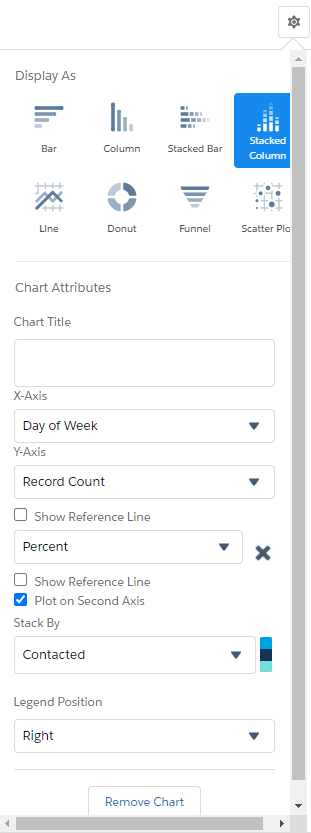
Contact Rate by Day of the Week
“Which day of the week is the best to call and make contact?”
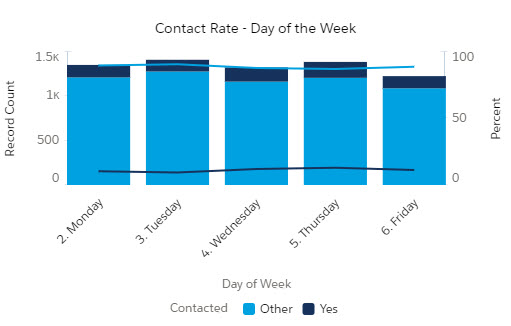
This report shows trends of contact rates by day. Find out if there is a better day of the week to call during than others. If there is, publicize the data to the team and protect that day(s) from internal meetings.
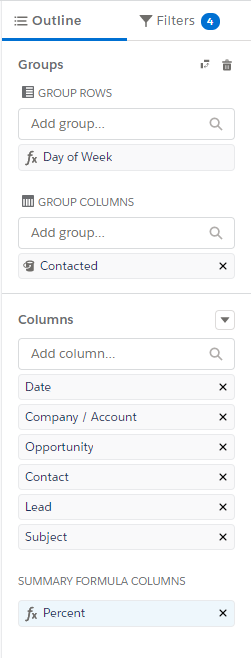
For this report to work correctly, you need to add this formula to the Day of Week column. Review the code below and click the button to copy the code.
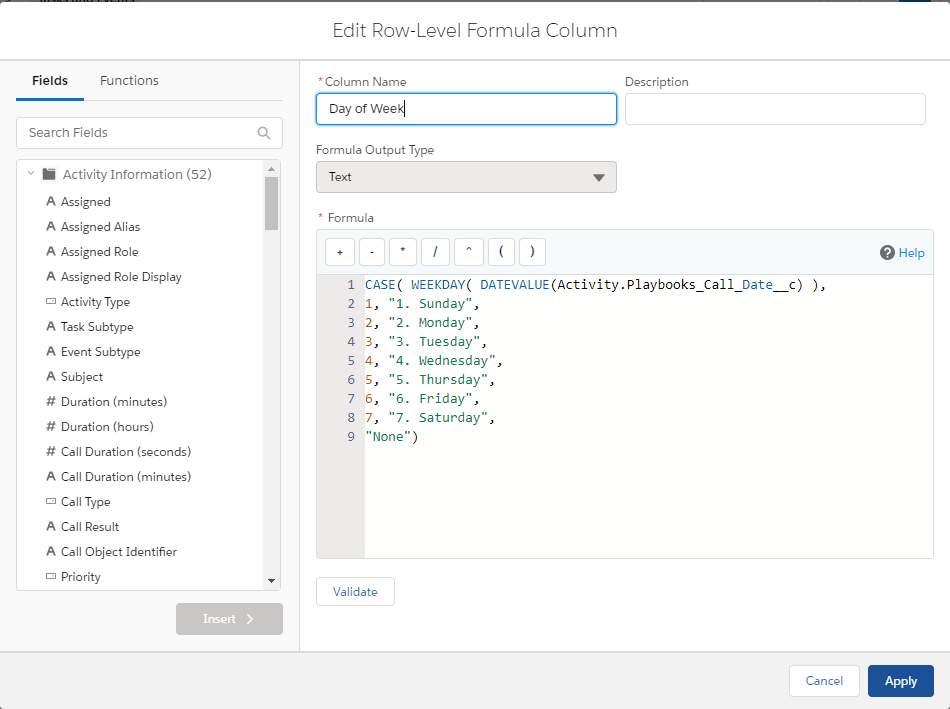
Column Name: Day of Week
Formula Output Type: Text
Formula:
CASE( WEEKDAY( DATEVALUE(Activity.Playbooks_Call_Date__c) ),
1, "1. Sunday",
2, "2. Monday",
3, "3. Tuesday",
4, "4. Wednesday",
5, "5. Thursday",
6, "6. Friday",
7, "7. Saturday",
"None")
This report requires a second formula in the Percent column. Review the code below and click the button to copy the code.
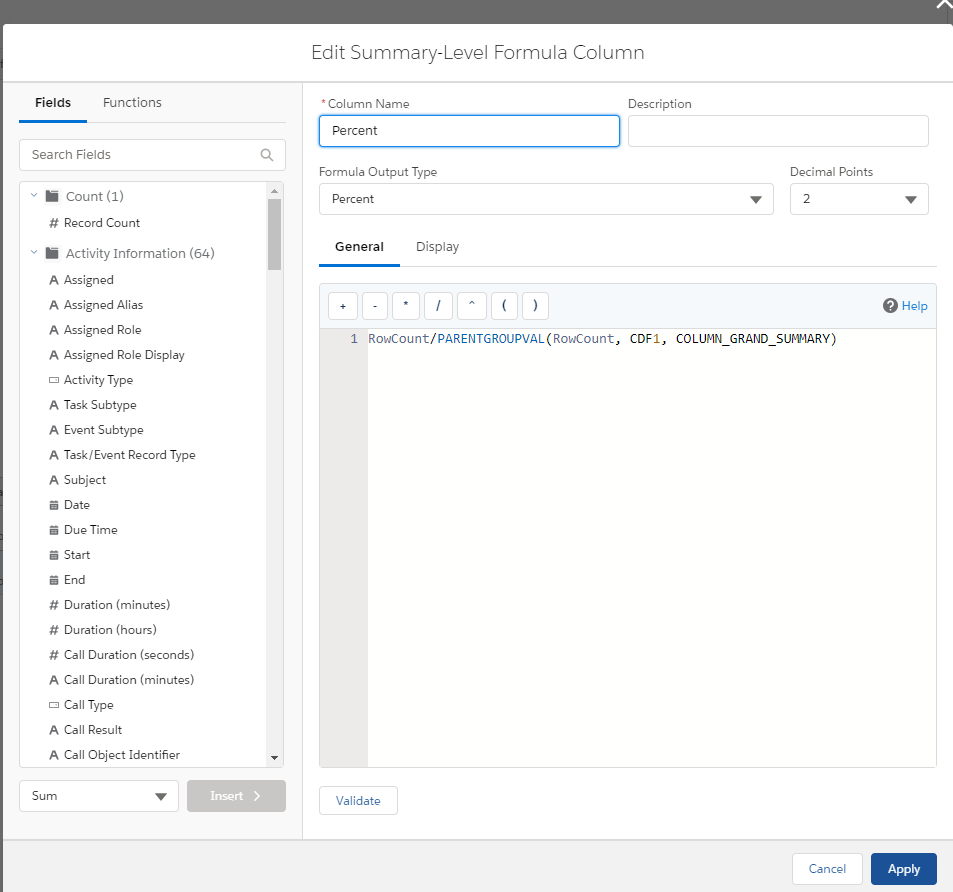
Column Name: Percent
Formula Output Type: Percent
Decimal Points: 2
Formula:
RowCount/PARENTGROUPVAL(RowCount, CDF1, COLUMN_GRAND_SUMMARY)
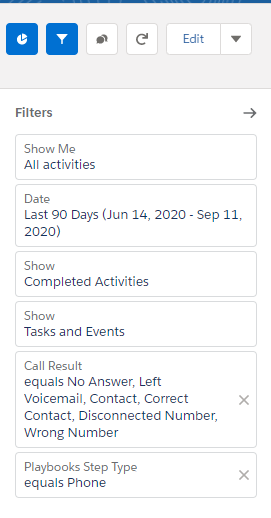
Contact Rate by Hour of the Day
“What time is the best to call and make contact?”
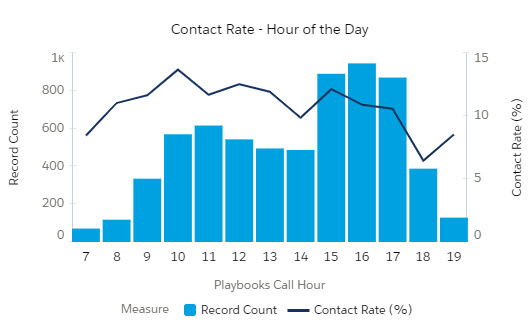
Using the Playbooks Call Hour field to capture the prospect’s local time, you can identify when prospects are answering their phones and adjust your strategy around those hours. For instance, have reps filter Playbooks tasks to identify phone call tasks by contact’s local time during those peak hours.
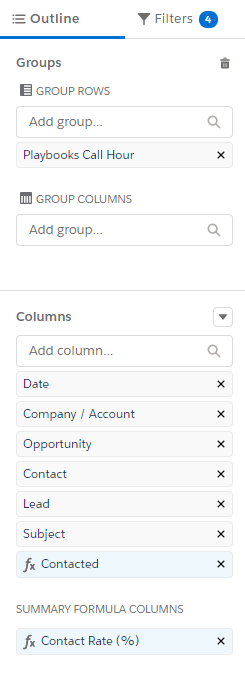

For this report to work correctly, you need to add this formula to the Contacted column. Review the code below and click the button to copy the code.
Column Name: Contacted
Formula Output Type: Number
Formula:
IF(

CALLDISPOSITION = "Contact" || CALLDISPOSITION = "Correct Contact",

1,

0

)


/* IF Call Result (CallDisposition) is "Contact" or "Correct Contact", display 1, if not display 0  */
This report requires a second formula in the Contact Rate (%) column. Review the code below and click the button to copy the code.
Column Name: Contact Rate (%)
Formula Output Type: Percent
Decimal Points: 2
Formula:
CDF1:SUM/RowCount


/*

Sum of Contacted, divided by total number of activities

*/
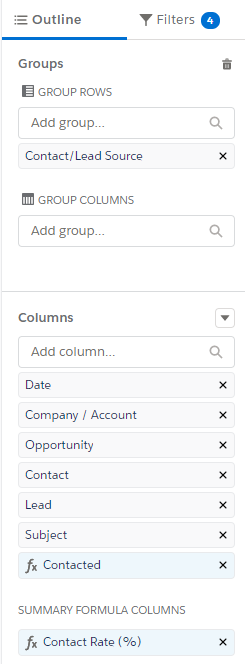
Contact Rate by Lead Source
“What is my contact rate on outbound calls, by Lead Source?”
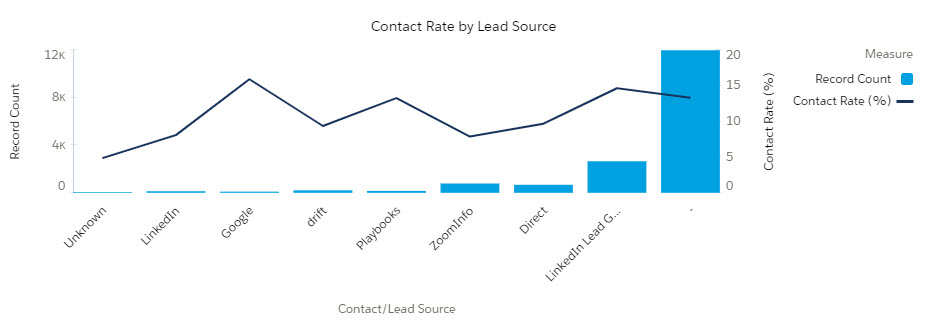
This report shows the contact rate on outbound calls by lead source. Once identified, teams can double down on phone efforts to the successful lead sources and strategize how to improve the other lead sources.

For this report to work correctly, you need to add this formula to the Contacted column. Review the code below and click the button to copy the code.

Column Name: Contacted
Formula Output Type: Number
Formula:
IF(

CALLDISPOSITION = "Contact" || CALLDISPOSITION = "Correct Contact",

1,

0

)


/* IF Call Result (CallDisposition) is "Contact" or "Correct Contact", display 1, if not display 0  */
This report requires a second formula in the Contact Rate (%) column. Review the code below and click the button to copy the code.
Column Name: Contact Rate (%)
Formula Output Type: Percent
Decimal Points: 2
Formula:
CDF1:SUM/RowCount


/*

Sum of Contacted, divided by total number of activities

*/