Reporting in Dynamics – Basic Charts and Dashboards
Using charts and dashboards included in the Playbooks Unmanaged solution
XANT provides an Unmanaged Solution that includes a set of charts and dashboards, allowing you to quickly gain improved insight into the activities your sales team is completing on a routine basis and the Plays that are driving your team strategy. Keep in mind that similar charts can easily be created without installing the Unmanaged Solution. Also, this Solution will add fields to your Lead, Contact, Phone Call, Email, and task Entity Forms. If you would like to take advantage of the canned charts and dashboard in the Unmanaged Solution, you can access the solution below.
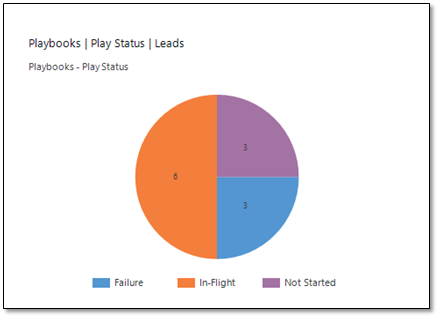
Chart – Play Status
This chart provides a manager number of records currently being worked, records yet to be actioned (or not started), and the records which have exited a Play (Success, Failure, or Unenrolled).
Identifying Success
If you double click to view the details of the records you can filter for records in a “Success” status. The Play Name will be displayed, and you can run analysis on successful Plays. Similarly, you can filter for your “Failure” records and make modifications to the Play’s cadence, cue cards, and email templates.
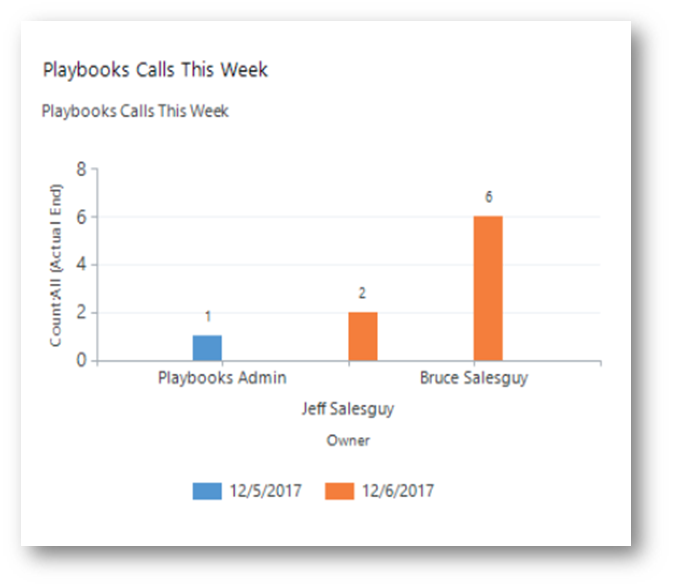
Chart – Playbooks Calls this Week / Playbooks Emails this Week
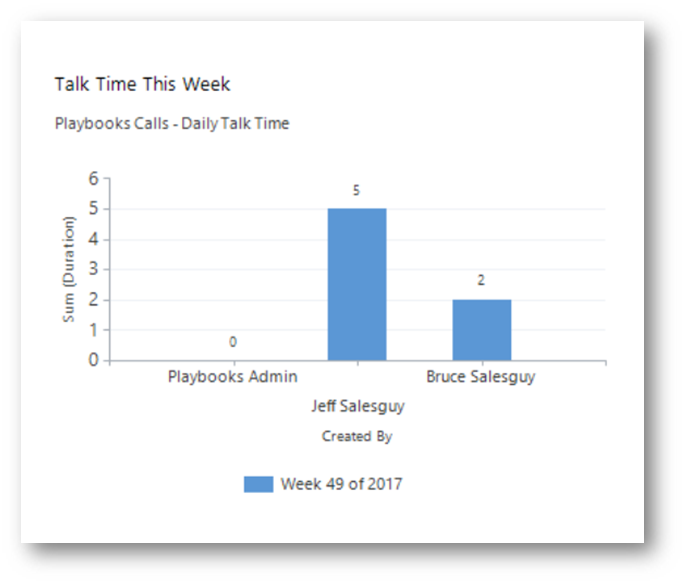
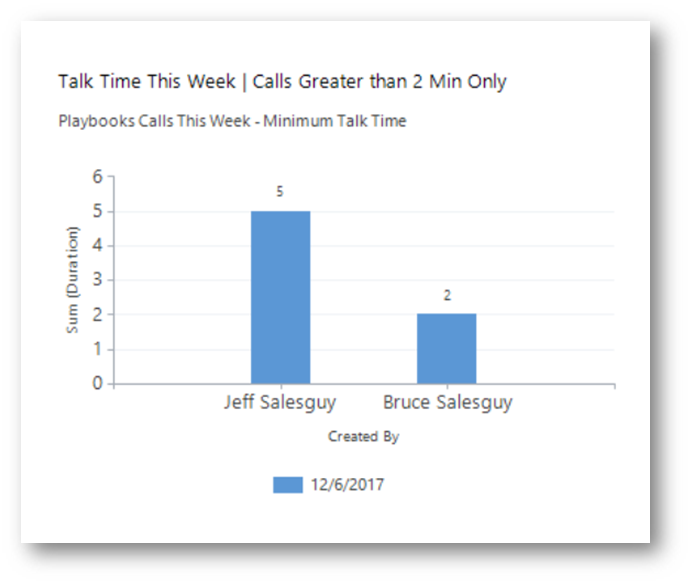
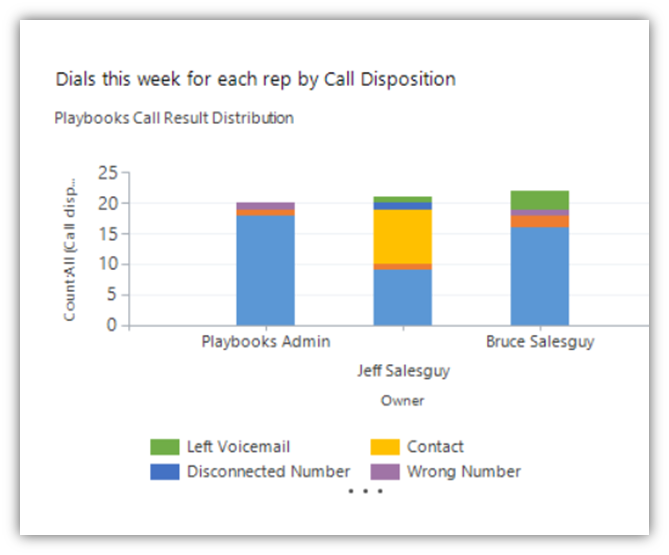
The first step to hitting your sales goals is ensuring consistent daily effort from the team. The fundamental measurements of effort is dials per rep per day and emails per rep per day.
This report removes self-reporting and only includes activities made using Playbooks.

